Trajectory charts
Every main view of the Trajectory module has its own page here. Each page says what the chart shows, what it is used for and how to read it, with an example chart and a short explanation film.
Where the charts are
The Trajectory workspace shows one to four panels. Each panel has its own view menu, so any panel can show any view. The menu has three groups:
| Group | Views |
|---|---|
| Well | Editor, Export, Reports, Import, Lease/Boundary Distance |
| Charts | 3D View, Plan View, Section View, Inc/Azi View, “Dogleg Severity, Inc”, Dogleg Severity, Traveling Cylinder, Survey Analysis, Map, and for drilled wells Survey Run QC (EOU Analysis, RIP Test) |
| Anti-Collision | Uncertainty, the anti-collision reports, Separation Factor Plot, Distance plot |
The uncertainty and anti-collision results are calculated when you press Recalculate. See Workspace & Wells.
The example
All pages use one example site, in US field units. The planned well, AWP 47 Plan, is vertical to 6,700 ft, lands horizontal at 10,870 ft TVD and runs north, then north-east, to 24,453 ft MD. It passes 213 to 252 ft below the laterals of four neighbouring wells, TALLGRASS 1H to 4H, which start from one pad at the site origin. Pages about surveys use the drilled well of the same design, MAIN. The numbers on each page are calculated results for this example, and the film on the page shows the same numbers.
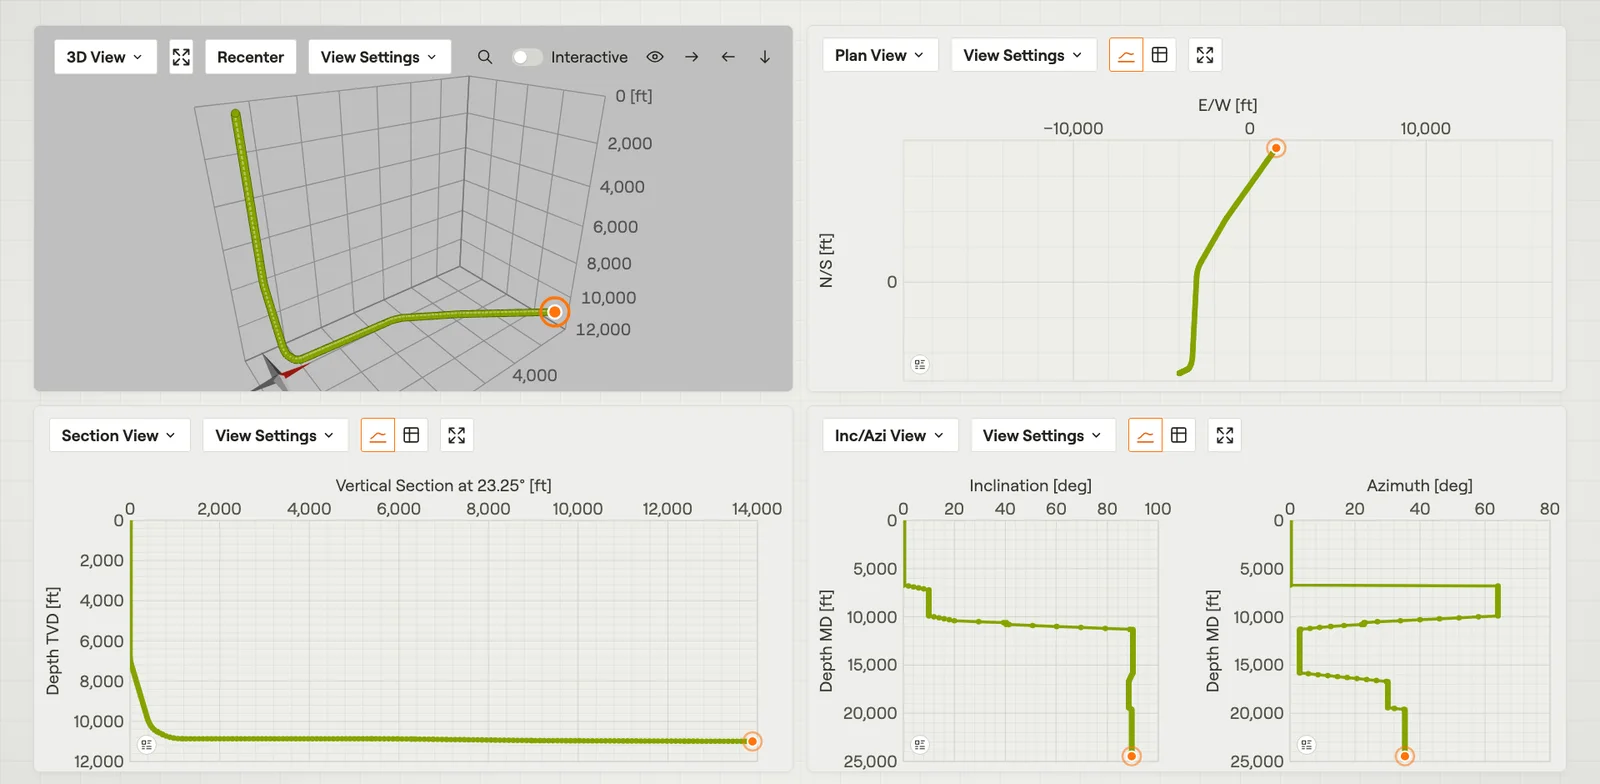 Workspace & WellsOne well path in up to four panels, each with its own view.Film · 2:07
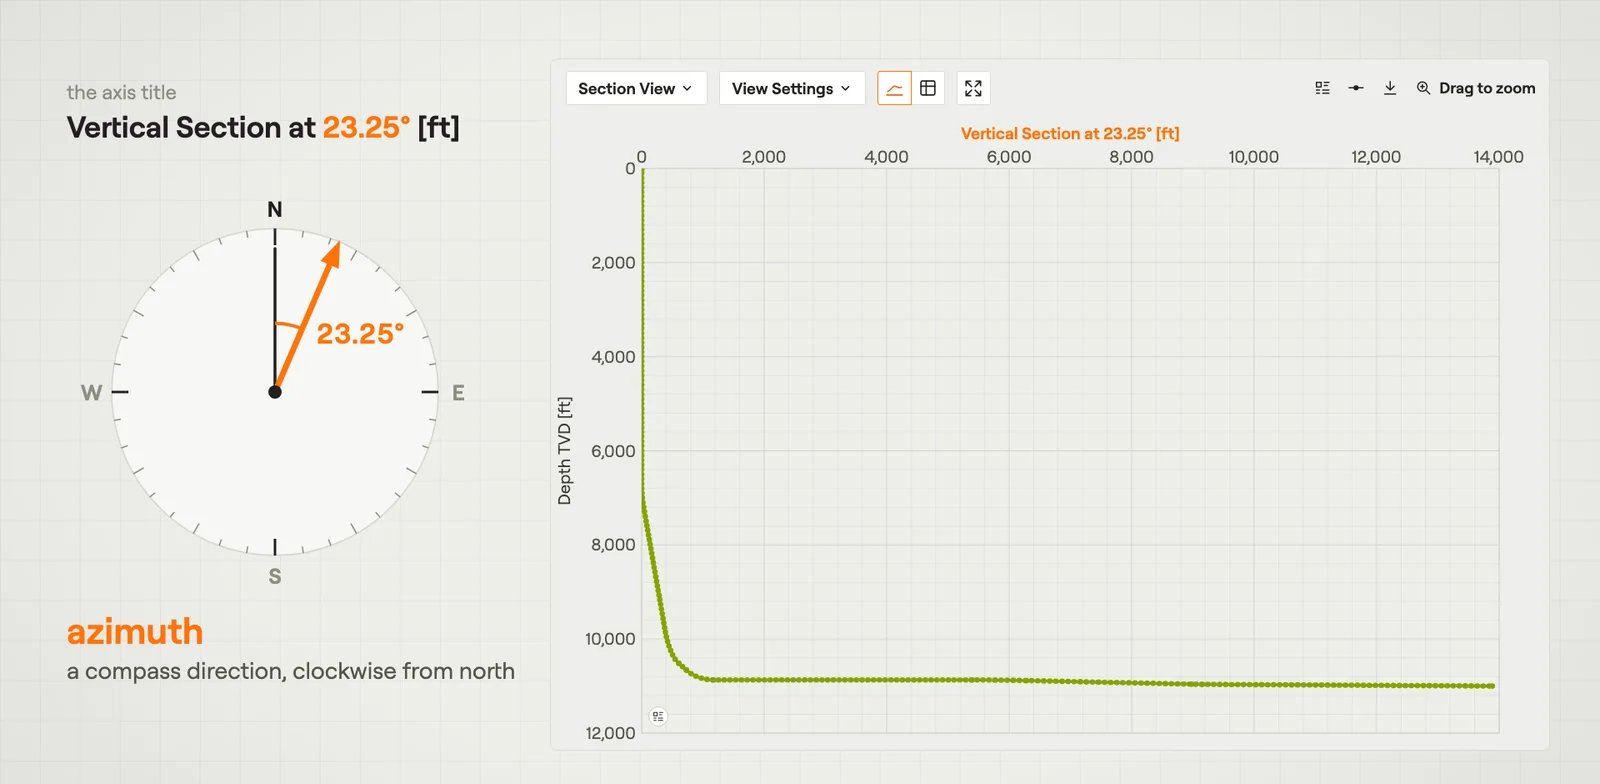 Section ViewThe well from the side: true vertical depth against vertical section.Film · 2:44
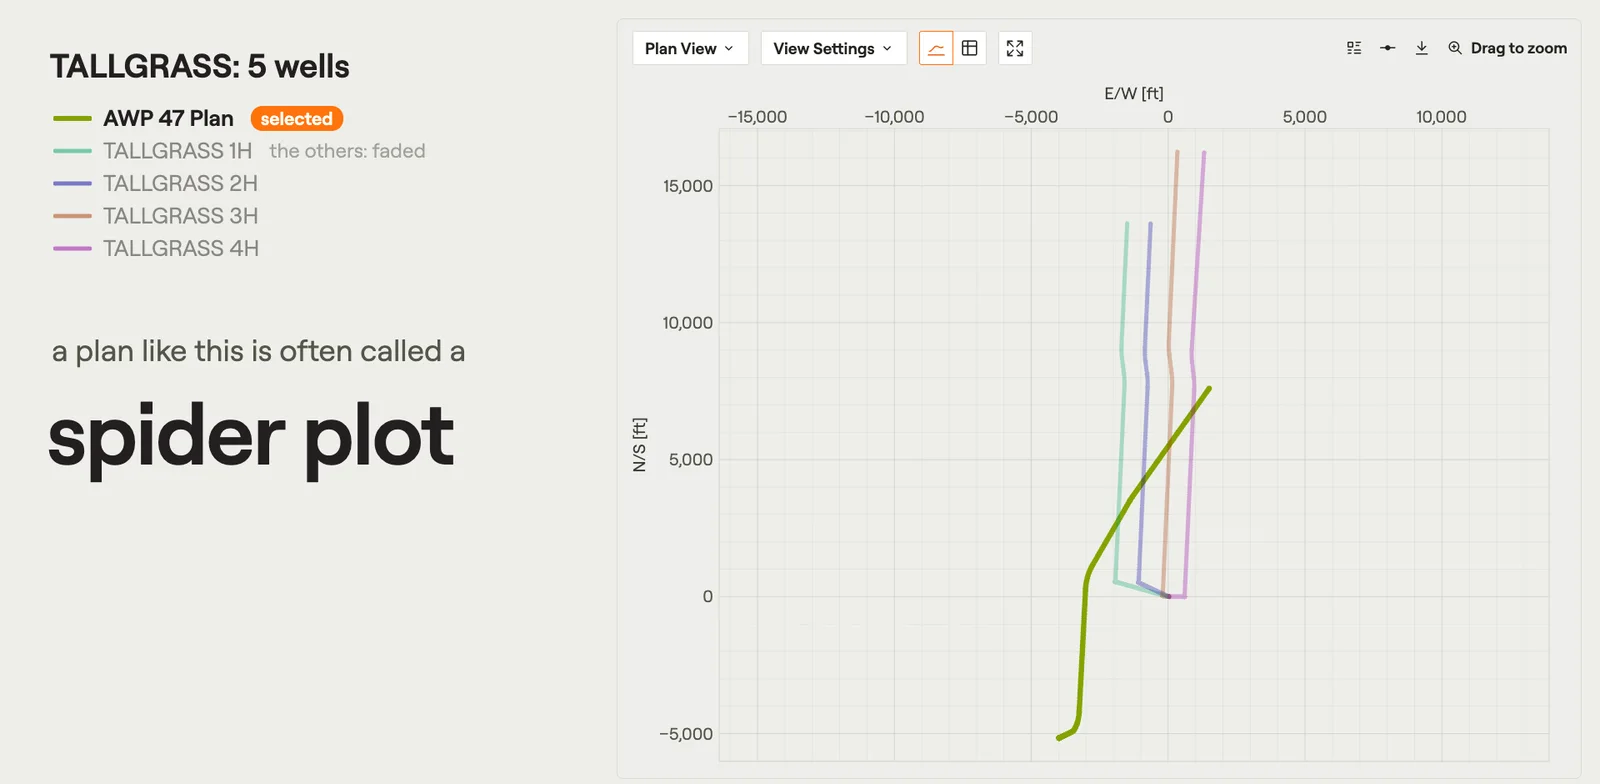 Plan ViewThe wells seen from straight above: north against east, from the site origin.Film · 2:08
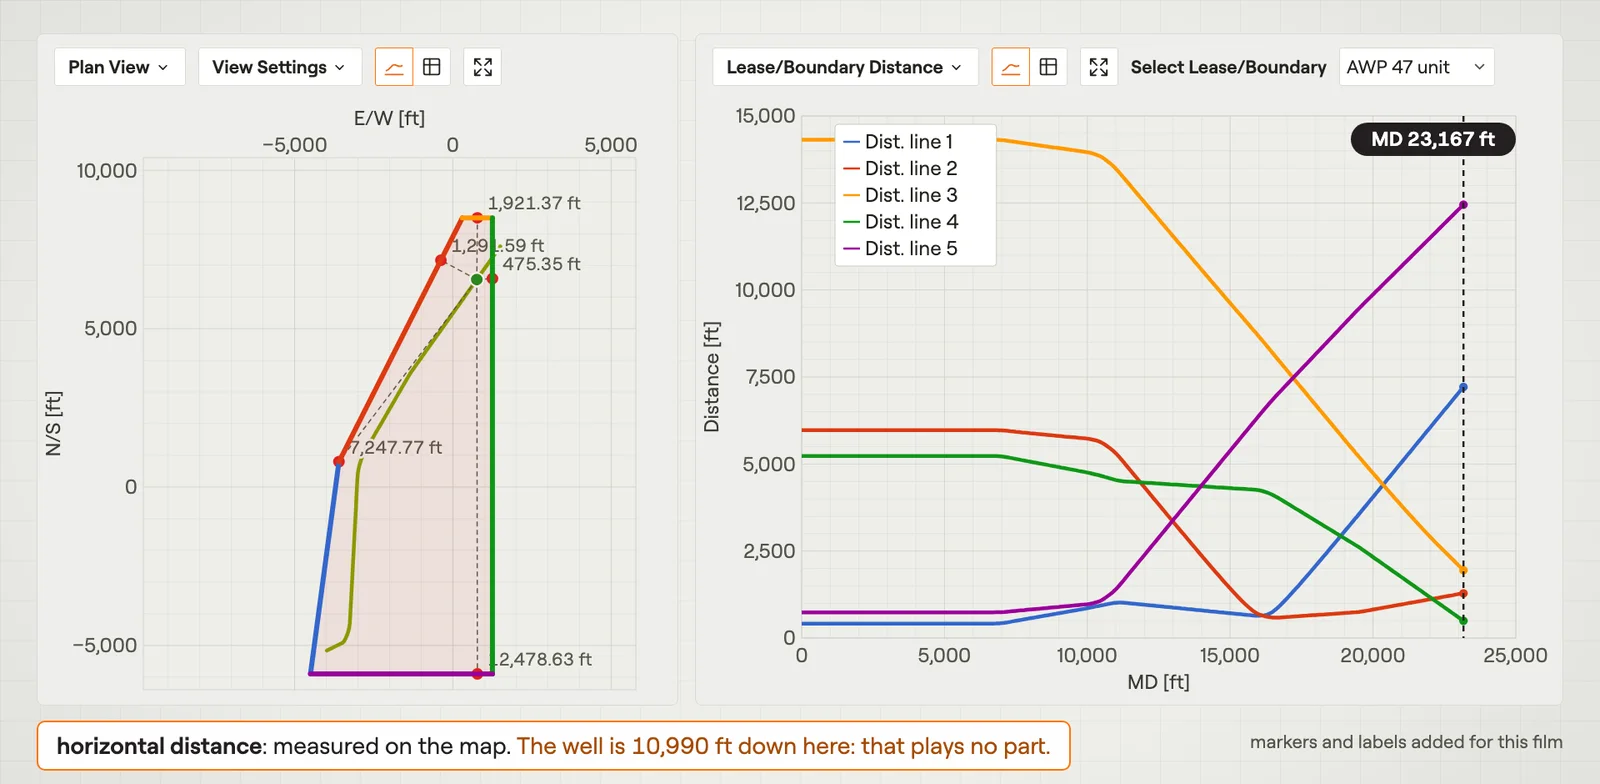 Targets & BoundariesWhere the well must go and must not go, and how close it comes to each lease edge.Film · 3:02
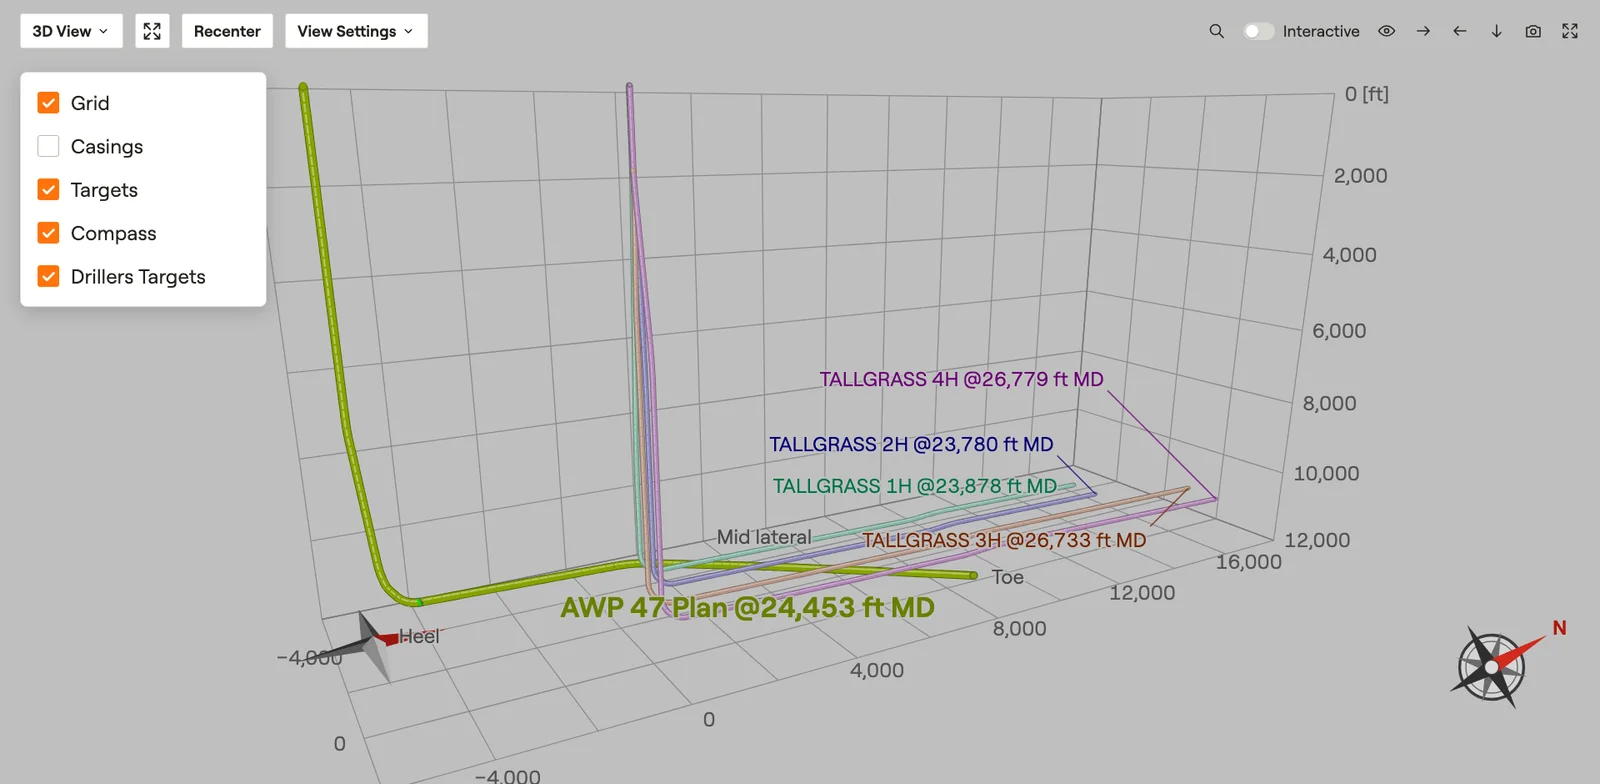 3D ViewThe wells in one 3D scene you can turn and fly through.Film · 2:31
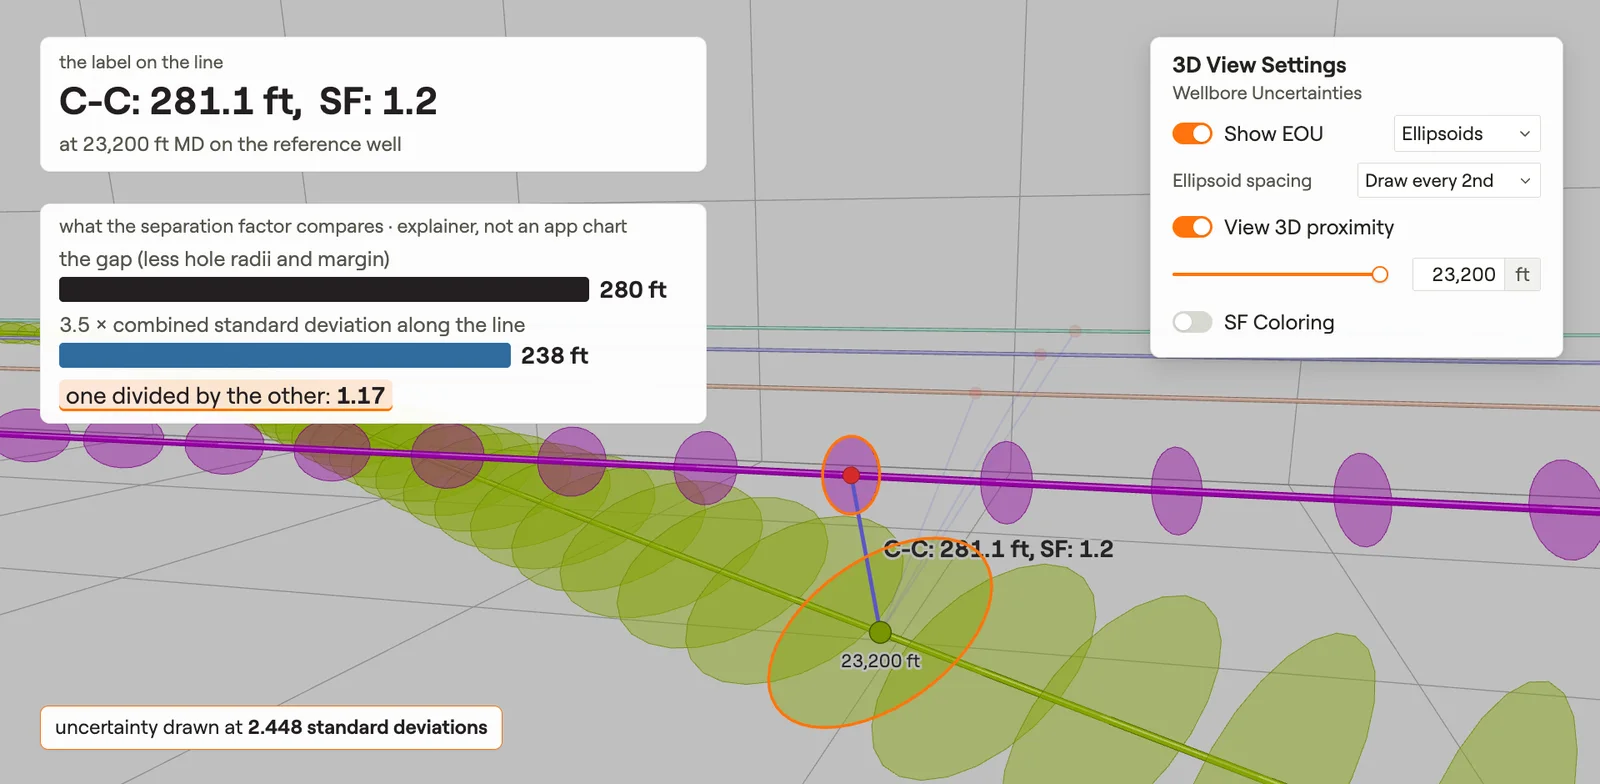 3D Uncertainty & ProximityHow far the real well may be from the plan, and how close it comes to its neighbours.Film · 3:00
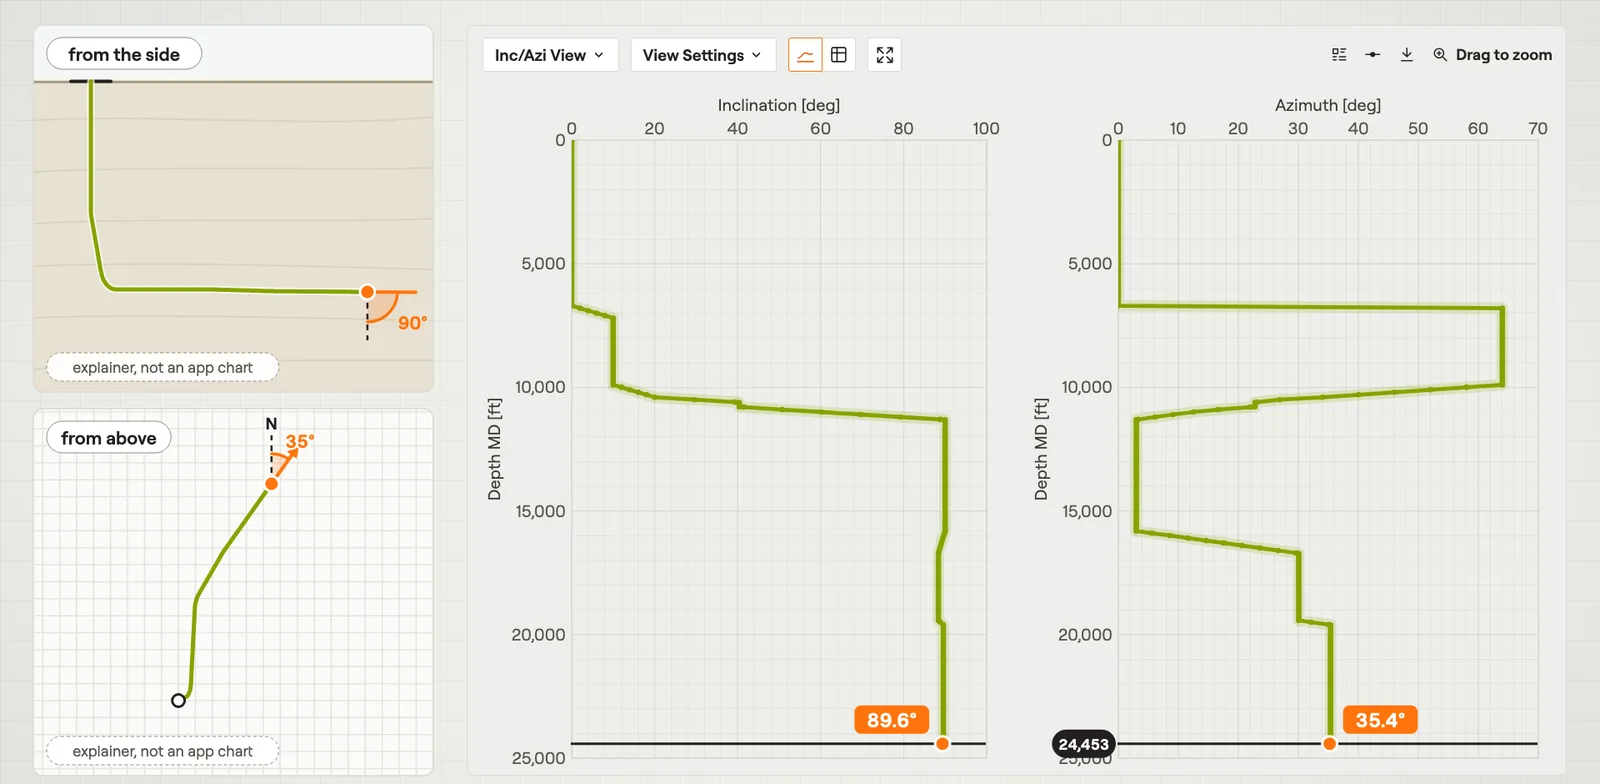 Inc/Azi ViewInclination and azimuth of the well against measured depth, side by side.Film · 2:42
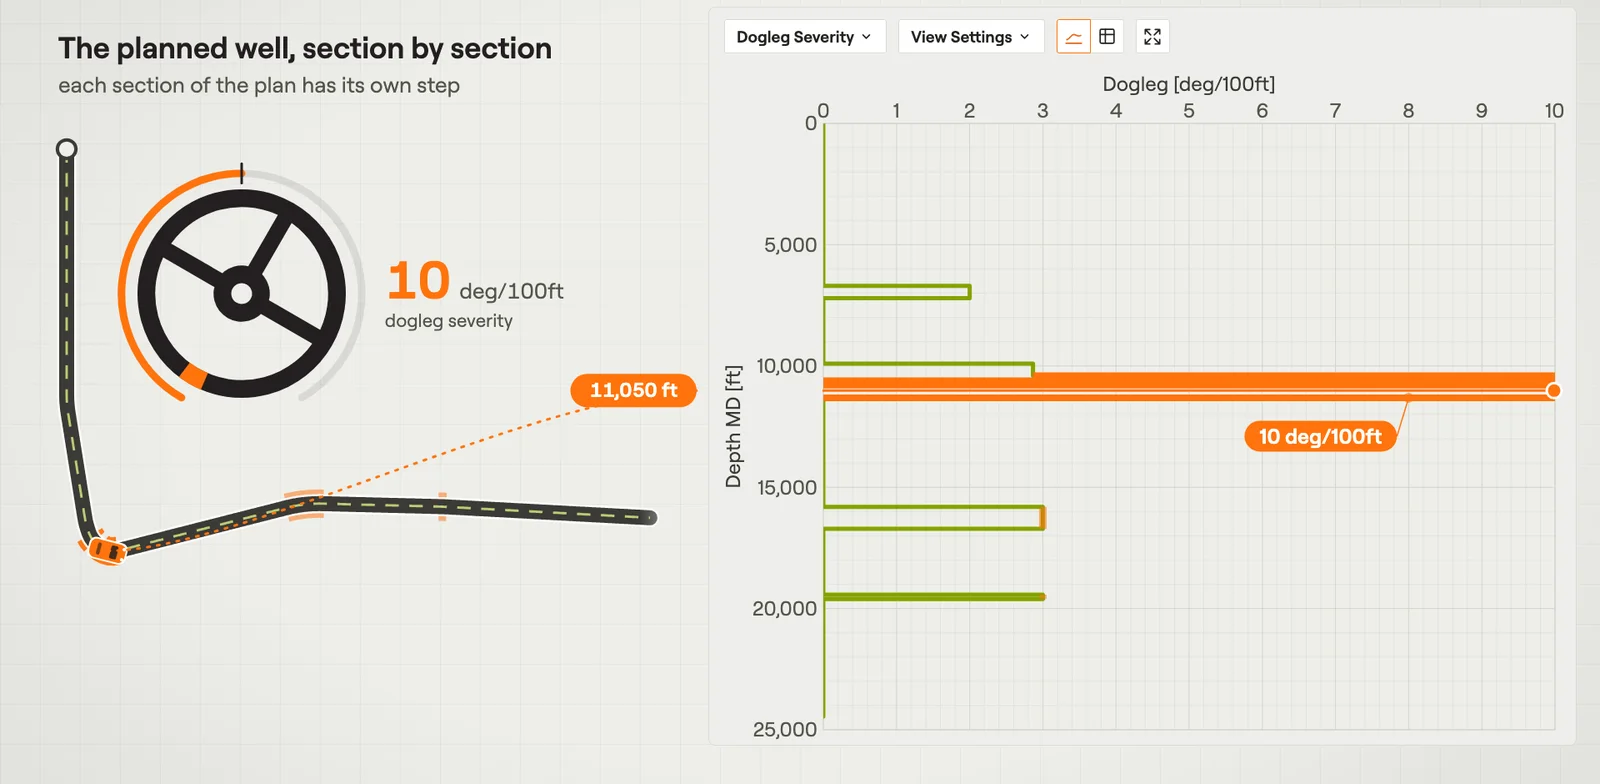 Dogleg SeverityHow sharply the well bends at each measured depth.Film · 2:51
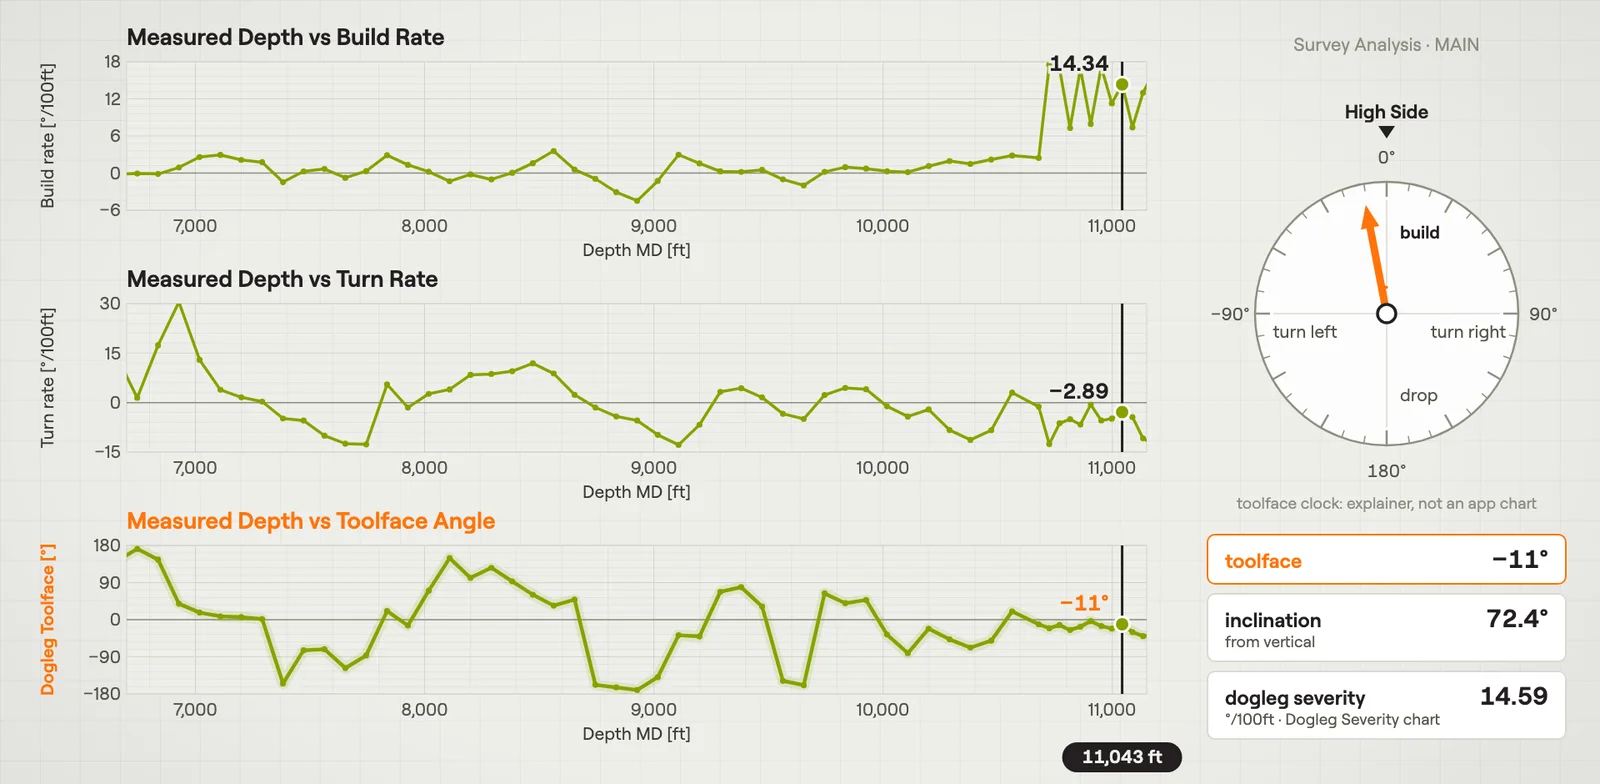 Survey AnalysisHow a well bends from one survey station to the next, against measured depth.Film · 3:05
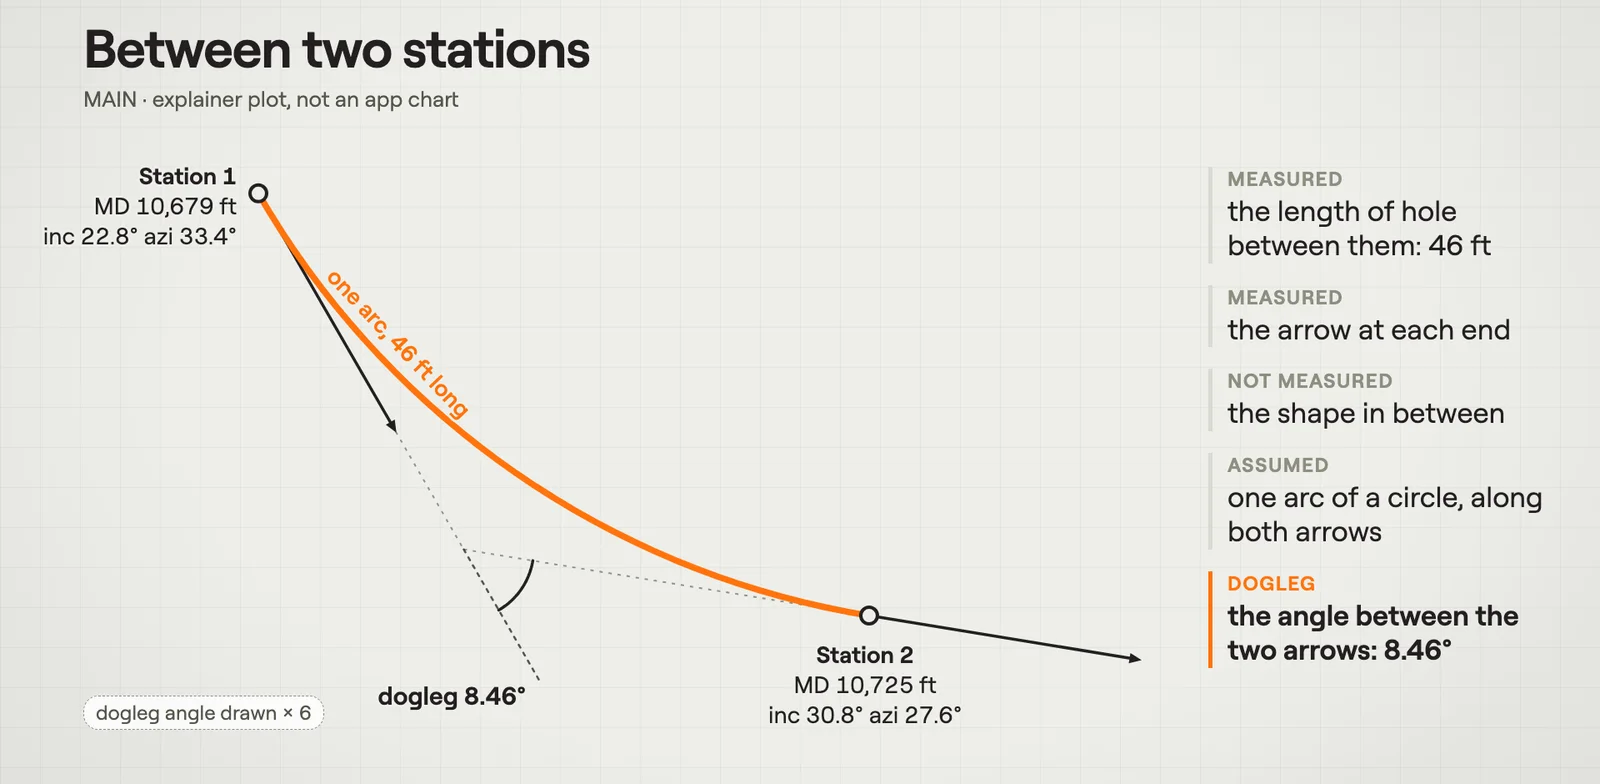 Minimum CurvatureMinimum curvature joins each pair of survey stations with one arc of a circle.Film · 3:01
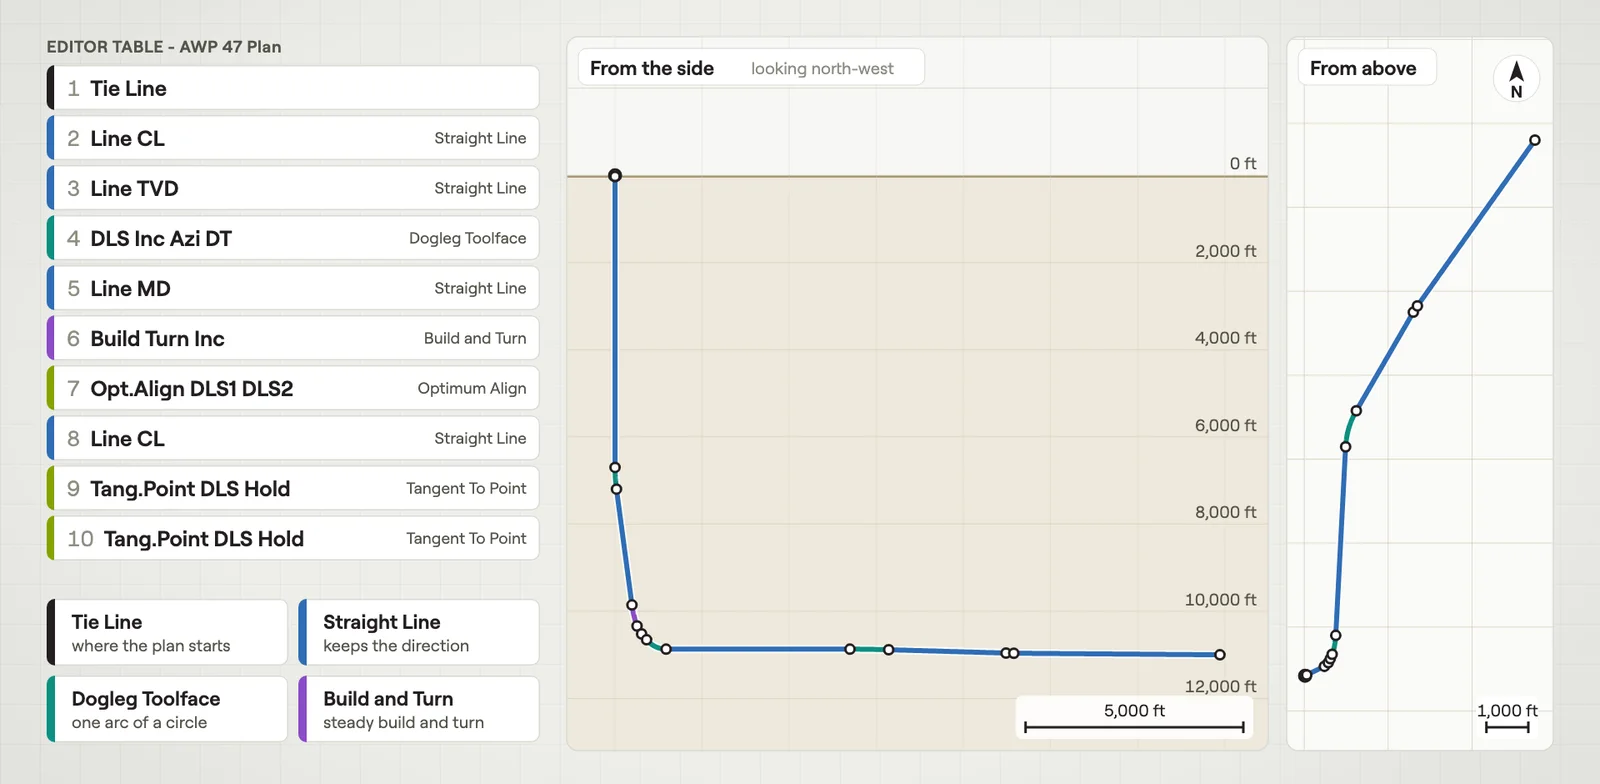 Plan SectionsEach row of the Editor table adds one piece of path, a straight line or a curve.Film · 3:07
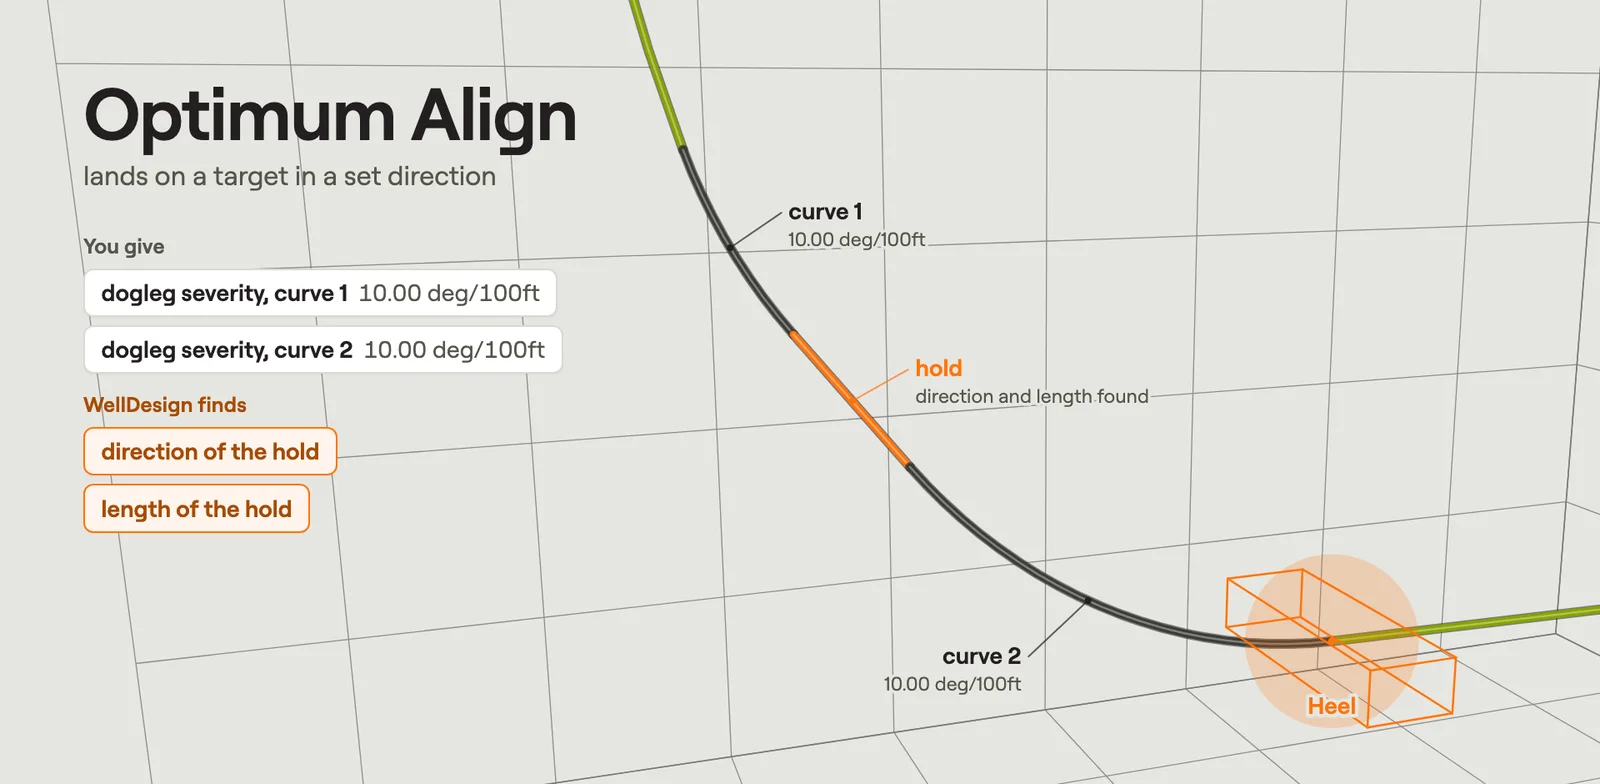 Build to TargetYou give a few numbers, and WellDesign finds the sections that land the path on a target.Film · 2:46
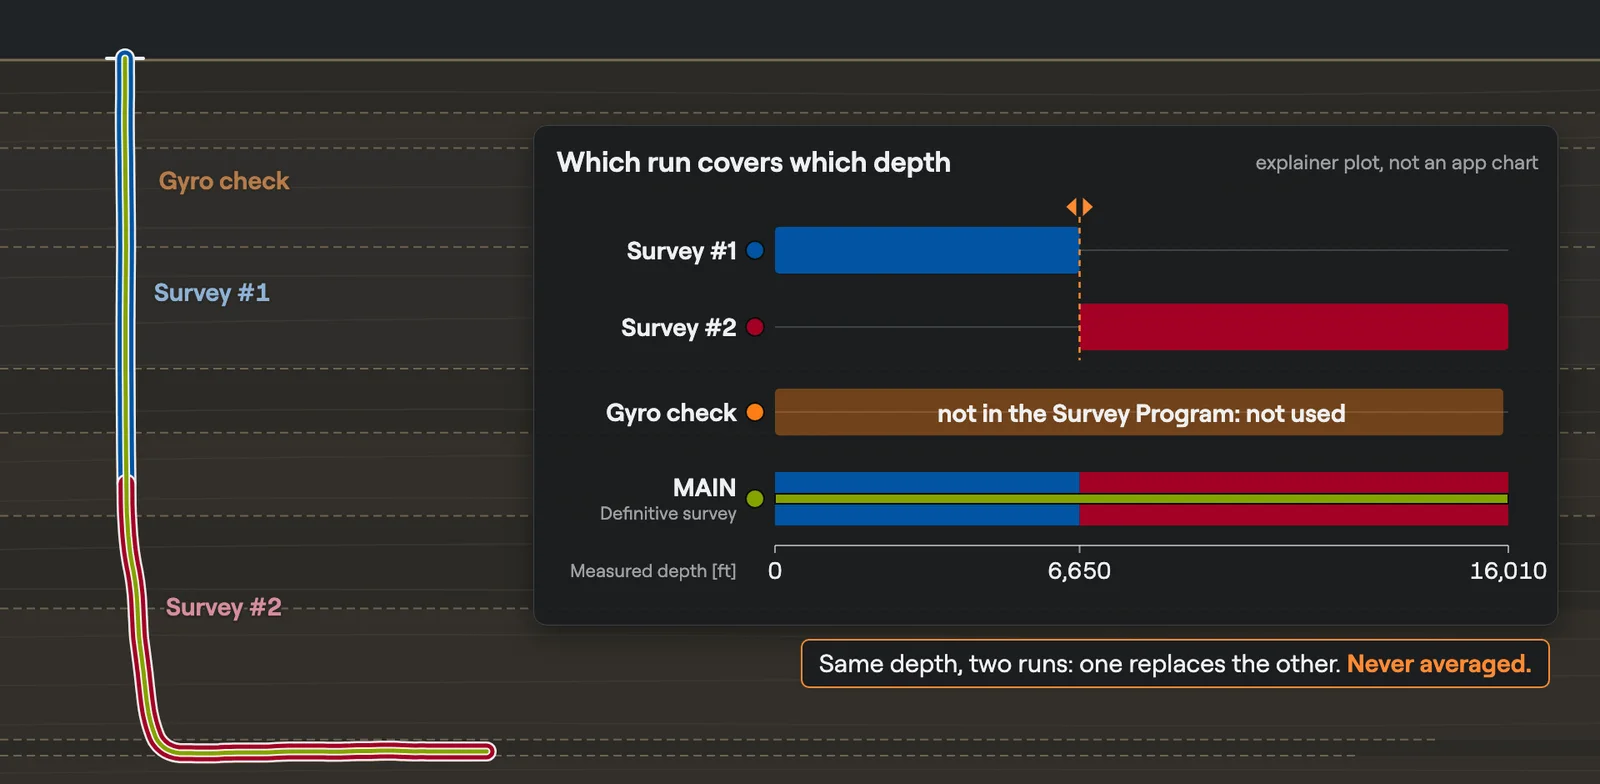 Survey Runs & Definitive SurveyThe chosen survey runs, joined into one path: the definitive survey.Film · 3:01
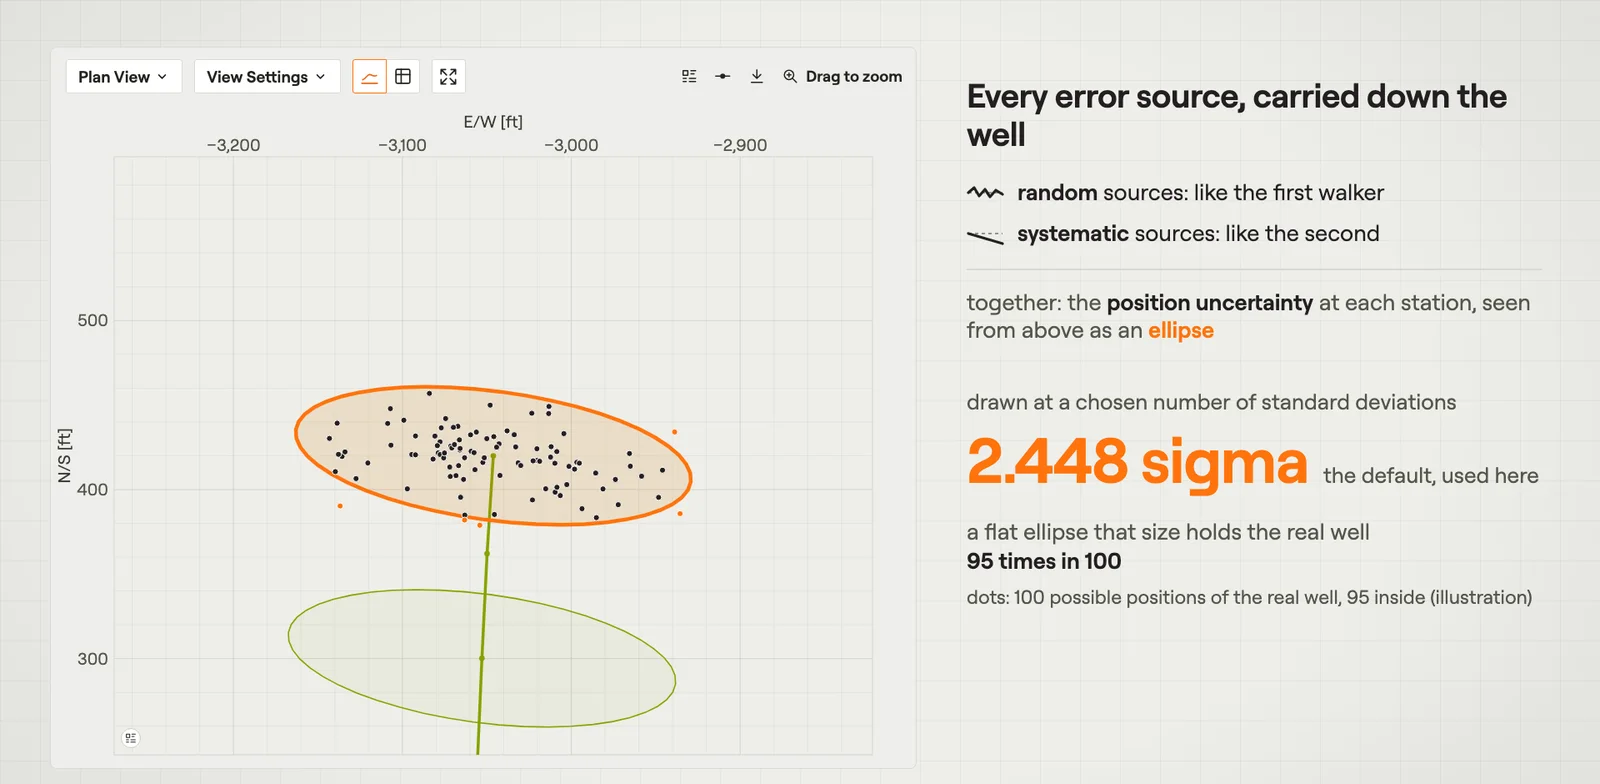 Error Models & UncertaintyHow far the real well may be from its calculated path, in a table and as ellipses.Film · 3:08
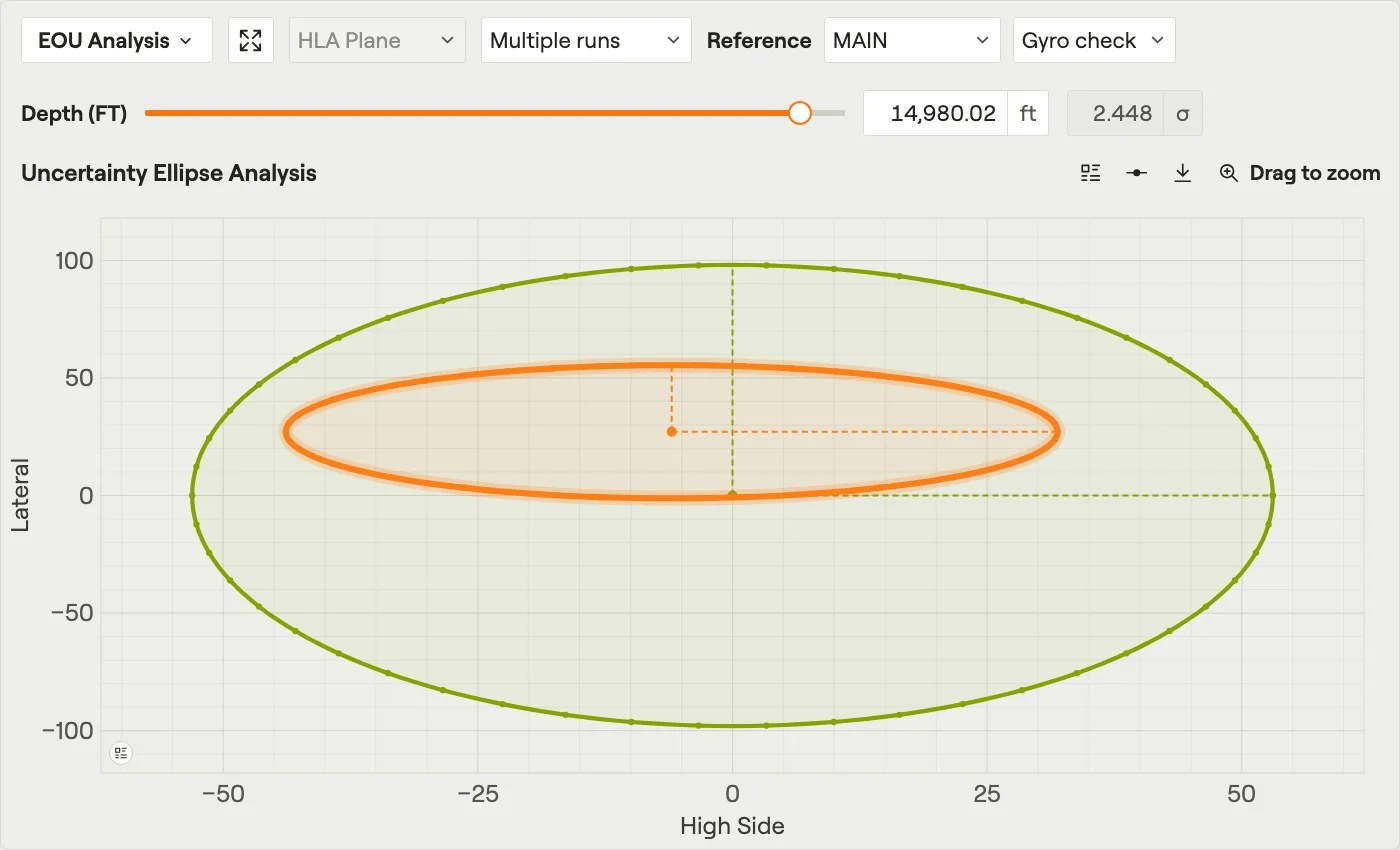 EOU AnalysisThe ellipse of uncertainty across the hole at one measured depth.Film · 2:53
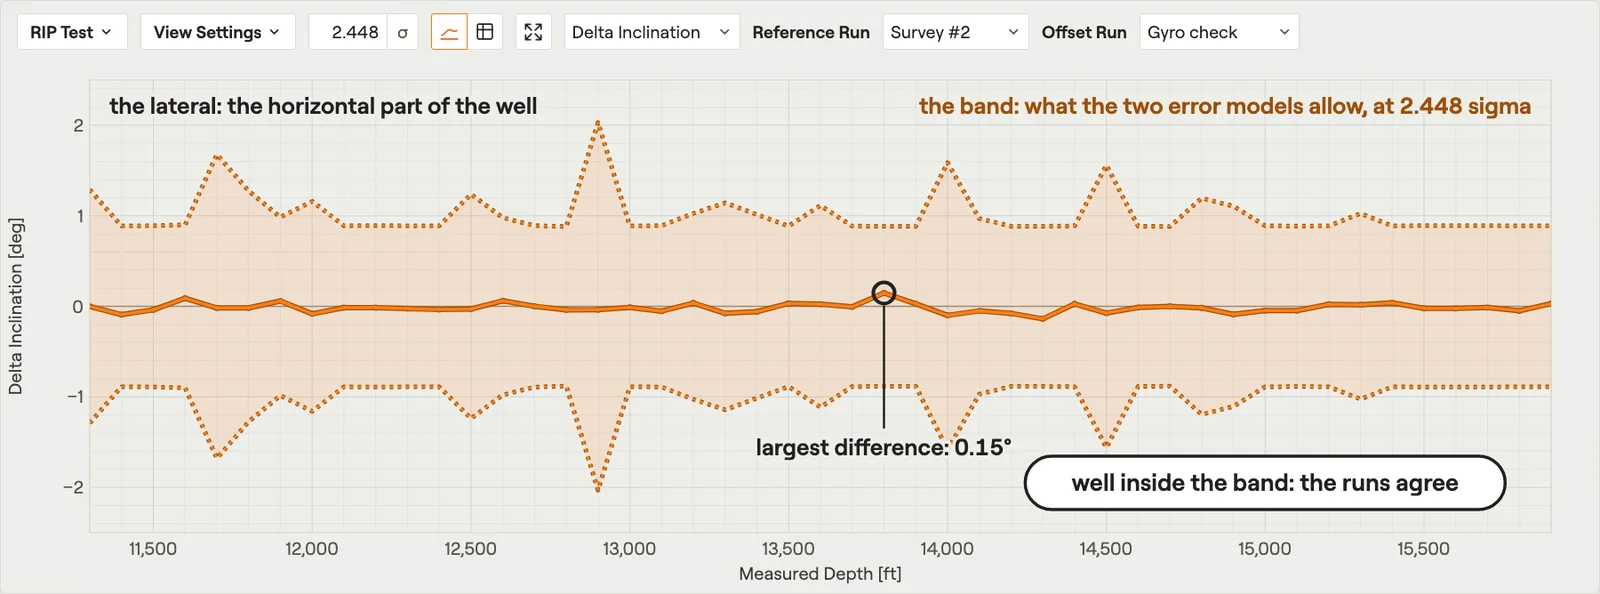 RIP TestThe difference between two survey runs of the same hole.Film · 2:29
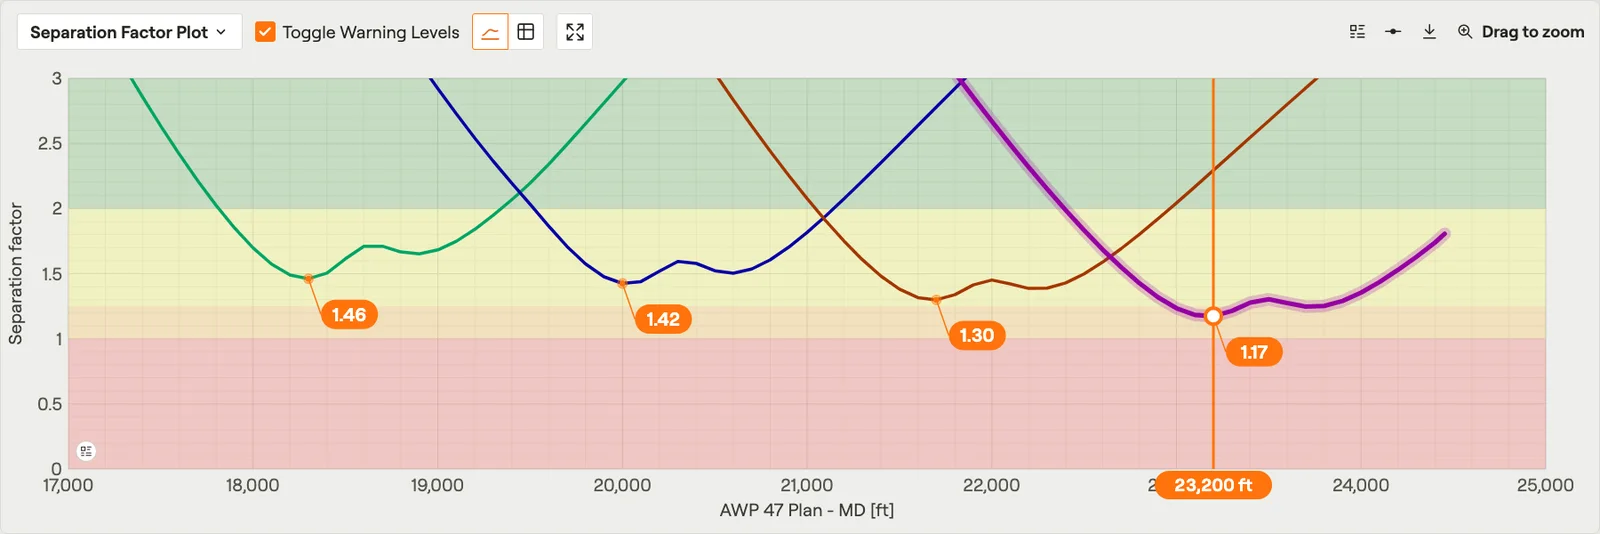 Separation Factor PlotThe separation factor against each offset well along the reference well.Film · 3:03
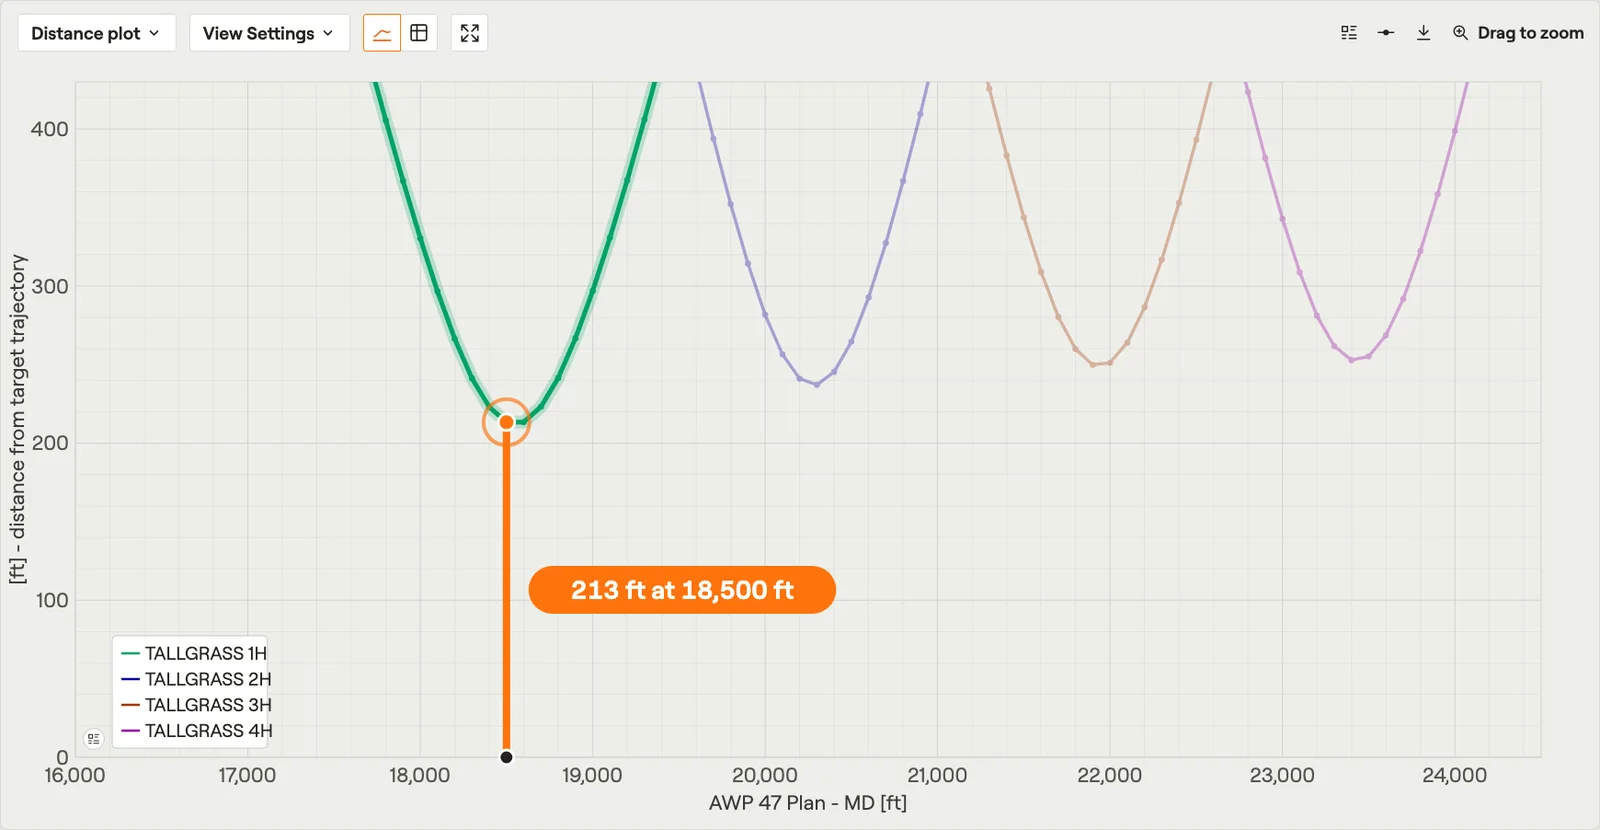 Distance PlotThe distance from the reference well to each offset well.Film · 2:37
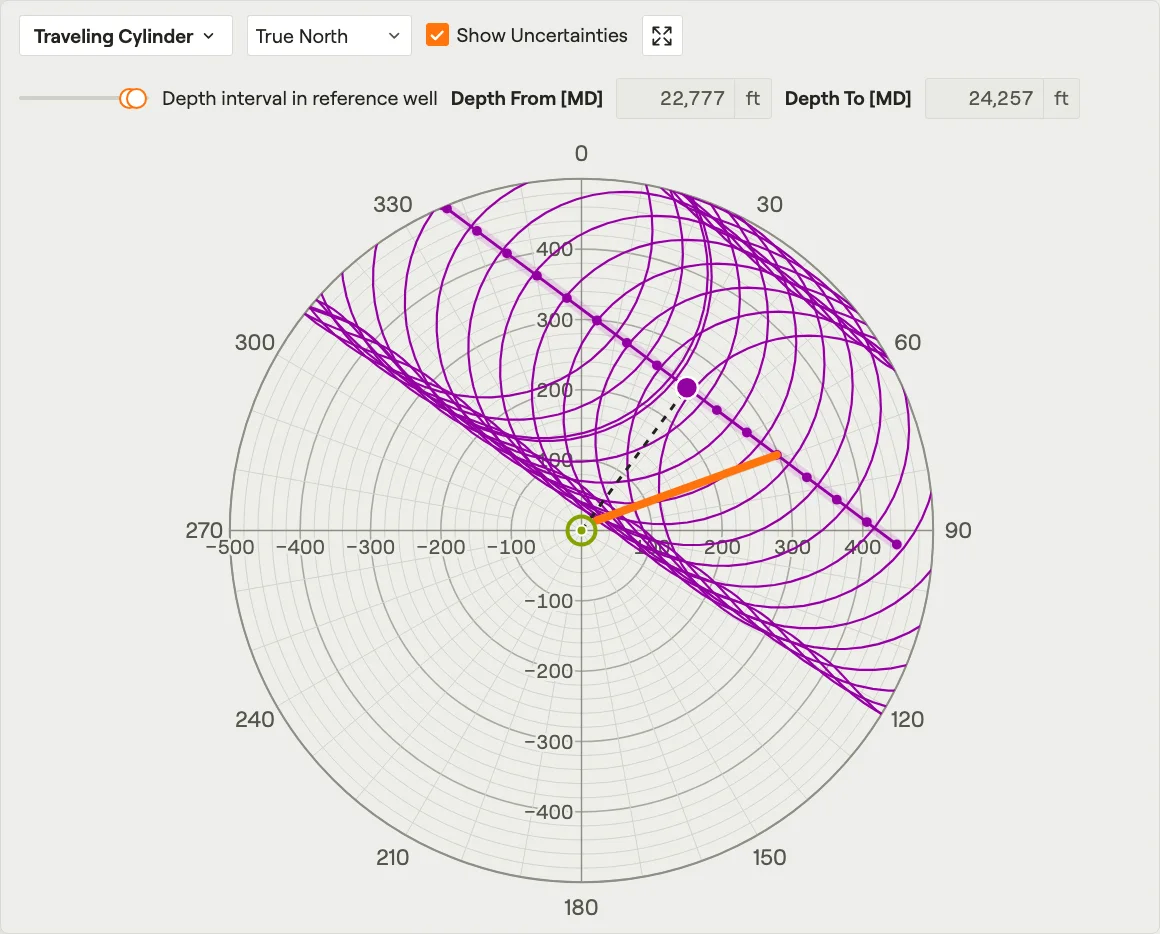 Traveling CylinderWhere the offset wells are, seen looking along the reference well.Film · 2:35
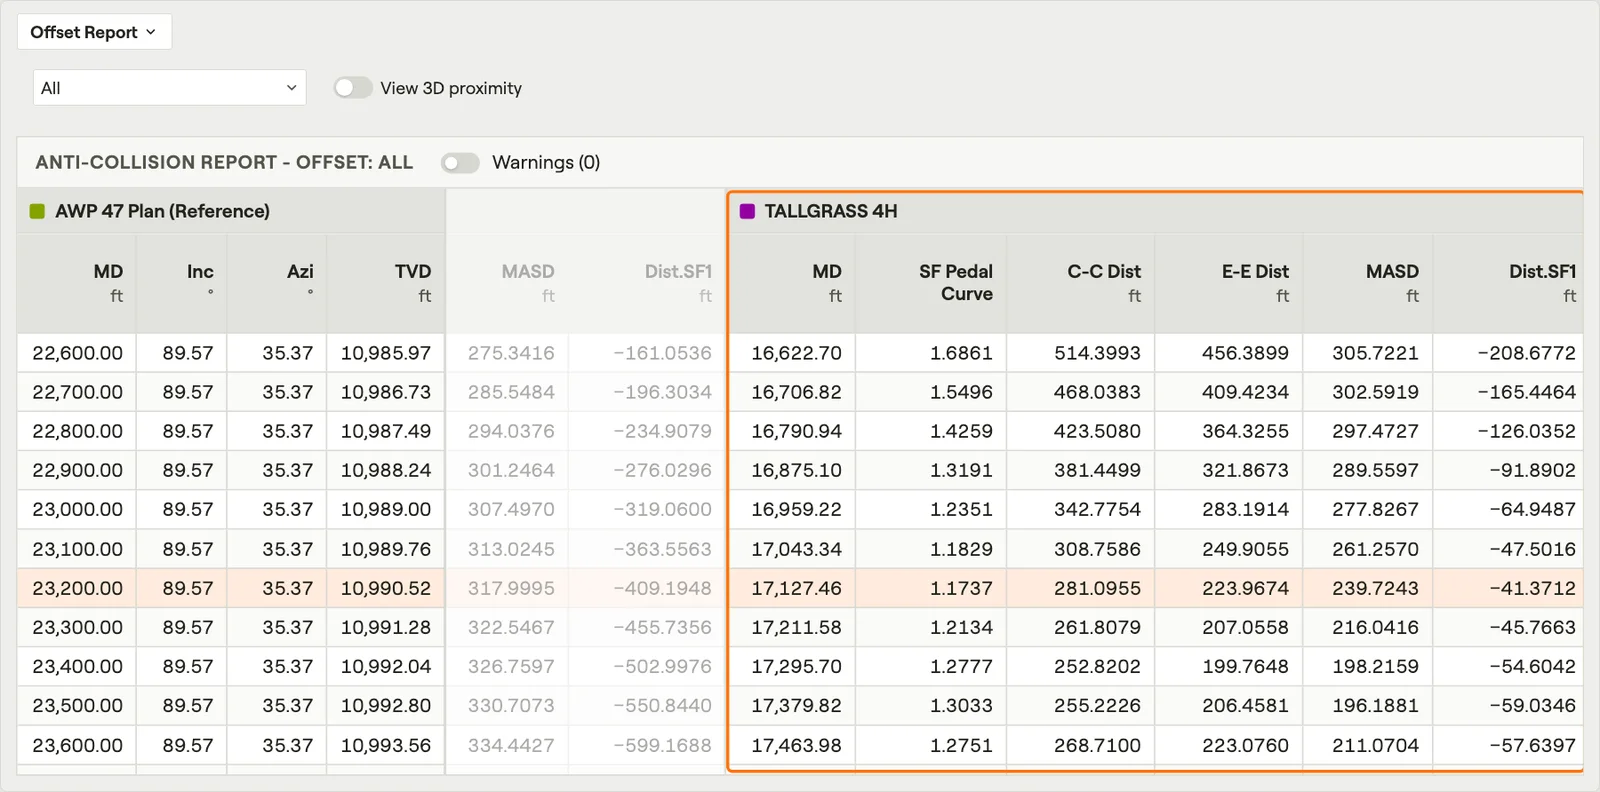 Anti-Collision ReportsAt every depth: how close each neighbour is, and whether that is too close.Film · 3:06
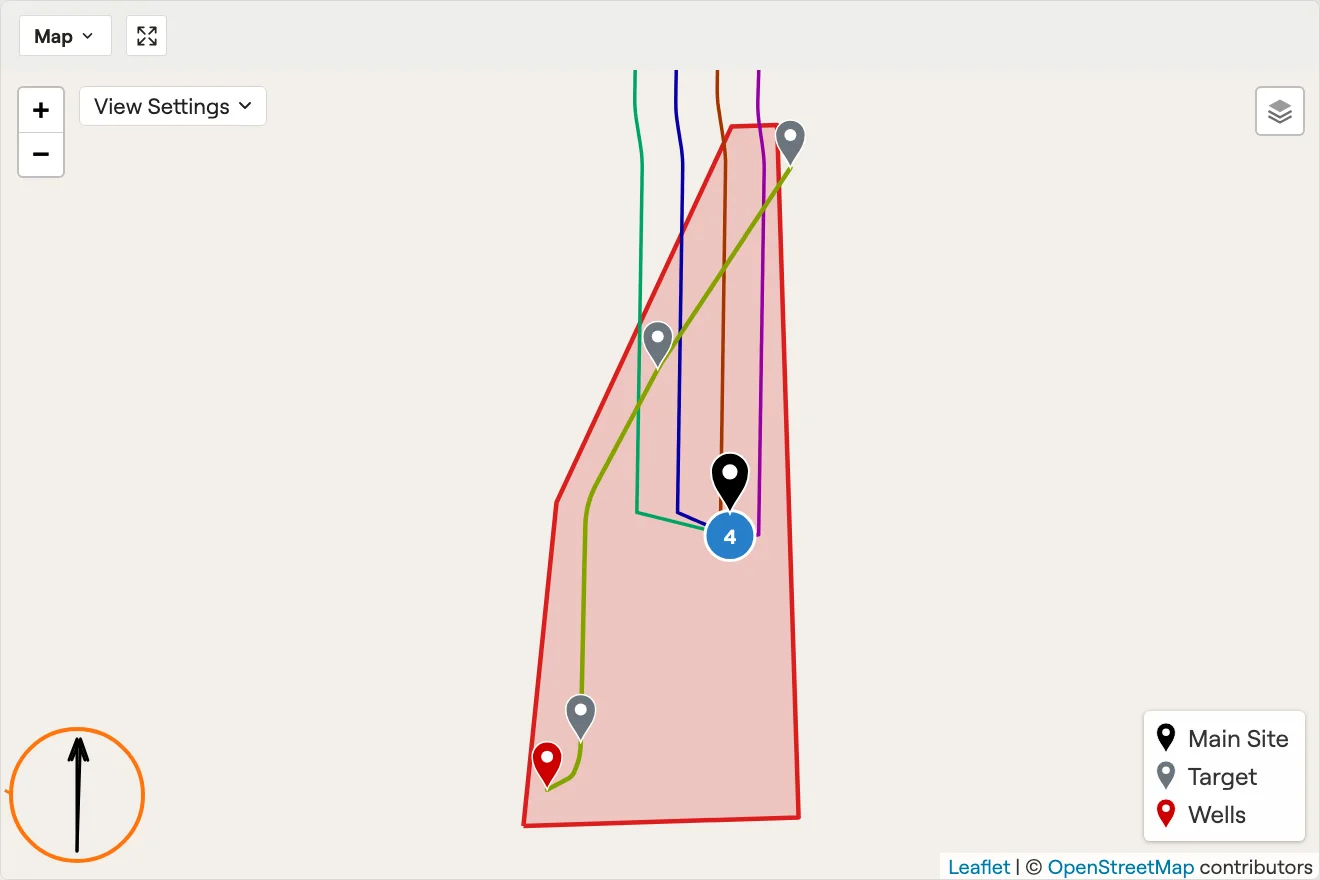 Map & Coordinate ReferenceThe site and its well paths on a real map, with grid and true north.Film · 2:47