Drilling Mechanics charts
Every main chart in Drilling Mechanics has its own page here. Each page says what the chart shows, what it is used for and how to read it, with an example chart and a short explanation film.
Two kinds of chart
Most Drilling Mechanics charts are one of two kinds. Knowing which one you are looking at is the first step in reading it.
| Kind | What a point on the curve is | Examples |
|---|---|---|
| Roadmap | The value with the bit at that depth. The bit moves from point to point. | Hookload, Roadmap ECD, Tripping Schedule |
| Fixed depth | A place along the well or the string. The bit stays at one depth for the whole curve. | Effective Tension, ECD at Depth, Side Force |
Fluid Train charts are plotted against time for one pumping schedule, and Casing Wear charts are plotted along the casing.
The example
All pages use one example well, in US field units: a deviated well with a 9 5/8 in casing shoe at 18,045 ft and total depth at 24,606 ft in 8 1/2 in hole. The lower part of the well is close to horizontal. The numbers on each page are calculated results for this well, and the film on the page shows the same numbers.
Torque & Drag
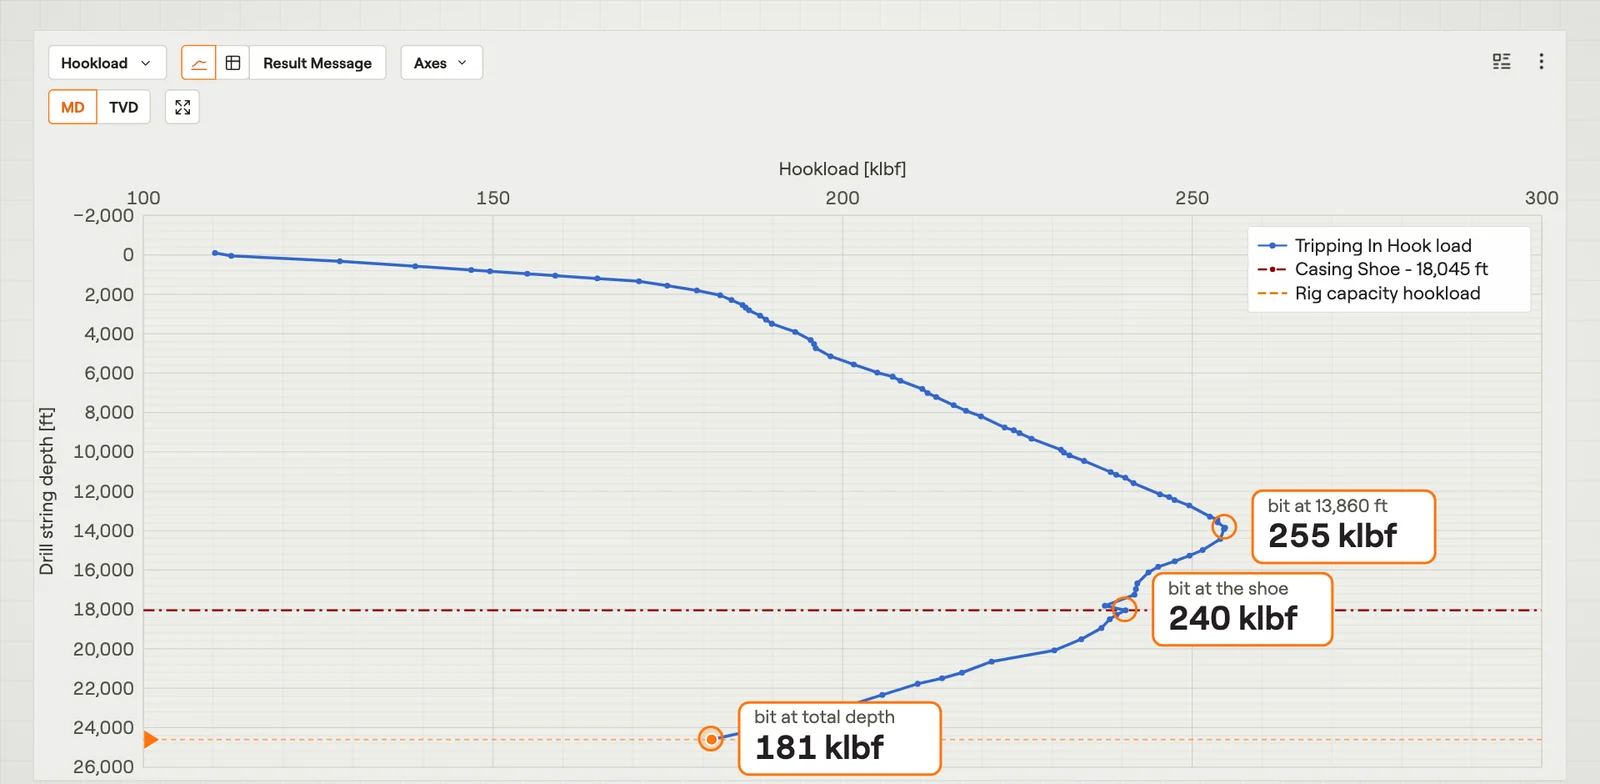 HookloadThe load on the hook for every bit depth of an operation.Film · 2:53
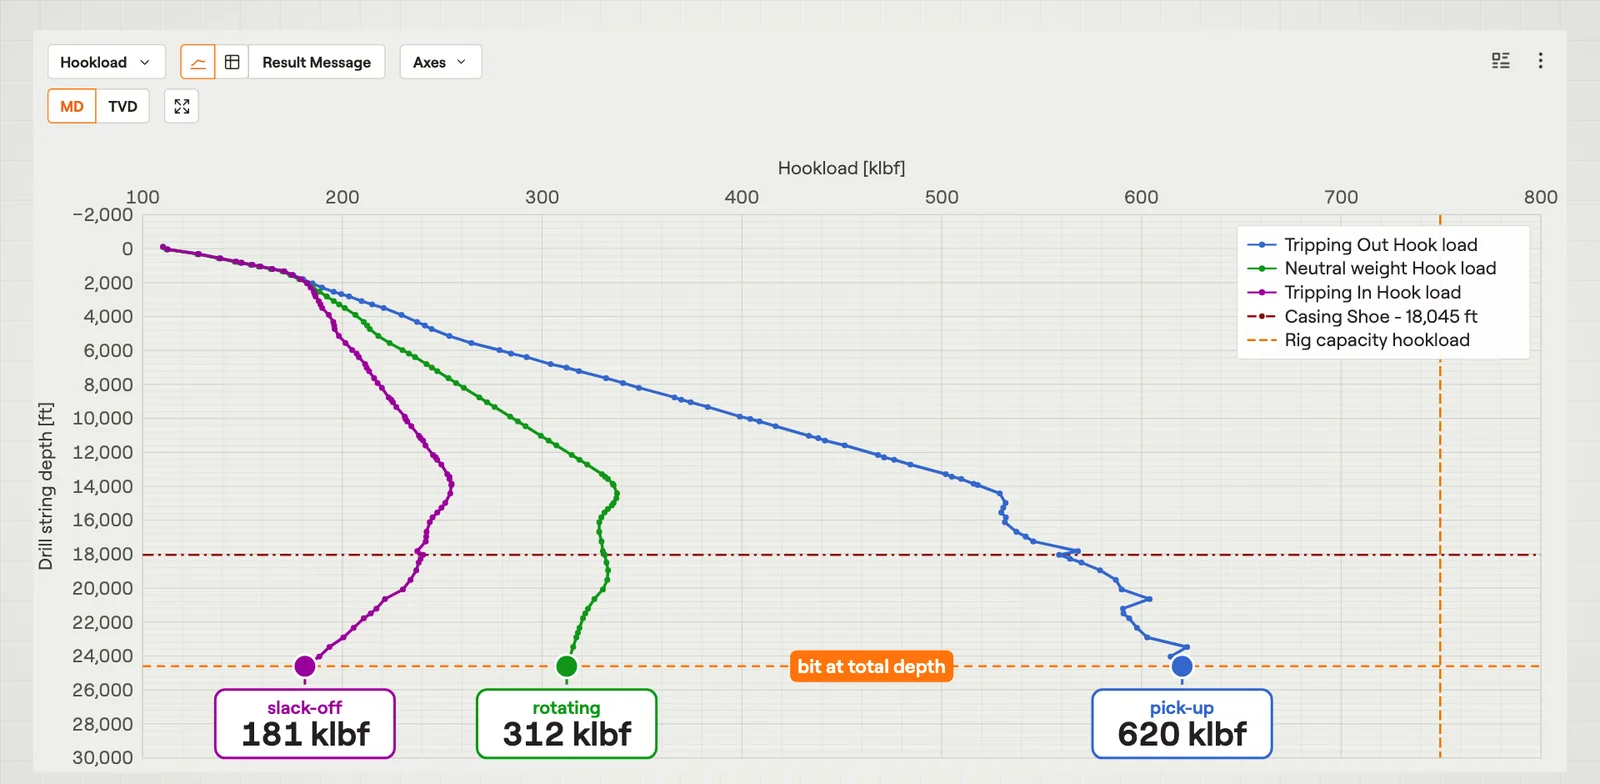 Pick-up, Slack-off & Rotating WeightHookload for tripping out, tripping in and rotating, on one chart.Film · 3:20
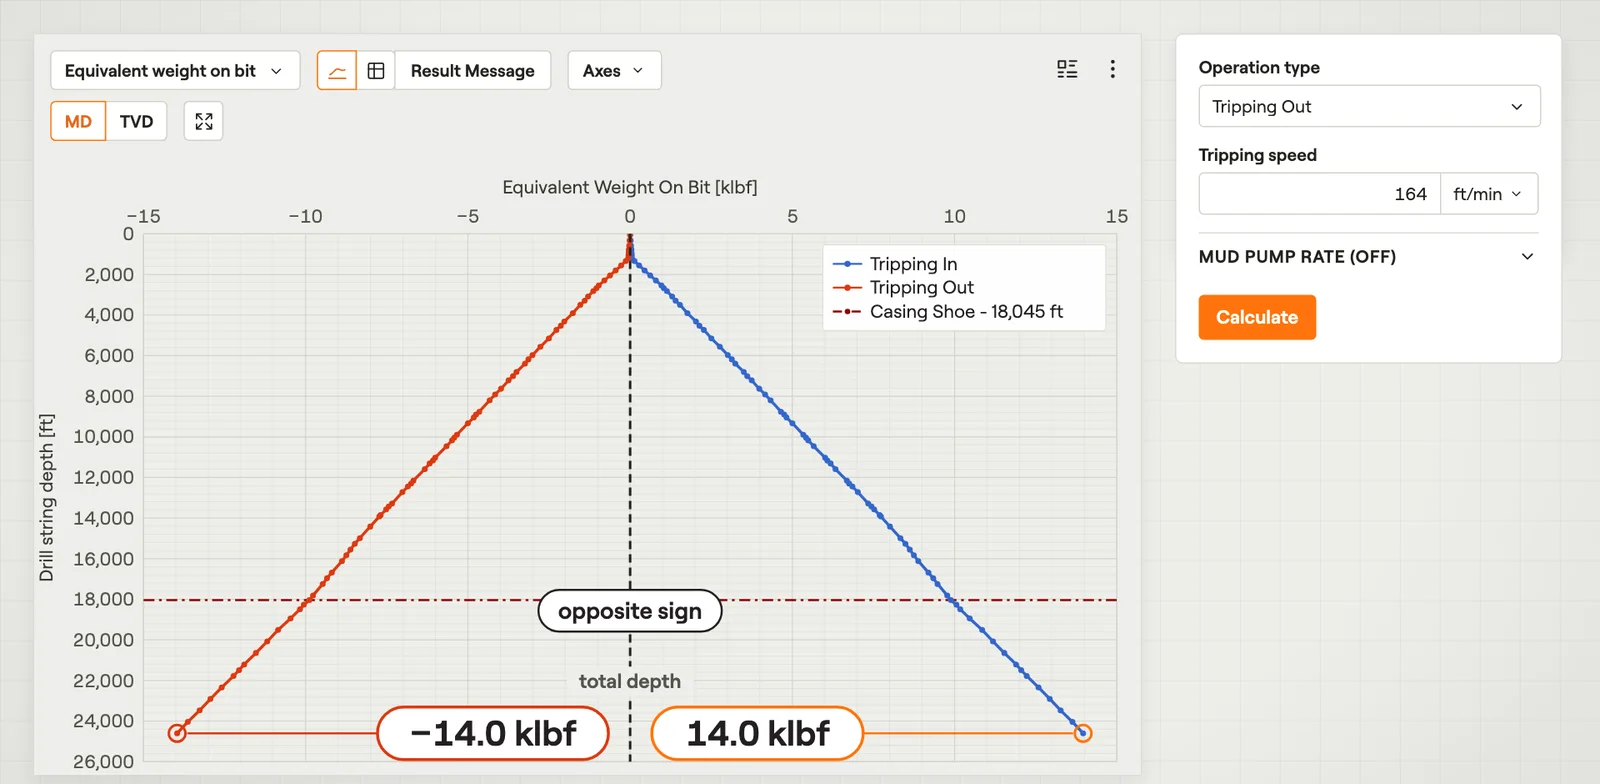 Equivalent Weight on BitThe force on the bottom end of the string for every bit depth.Film · 2:40
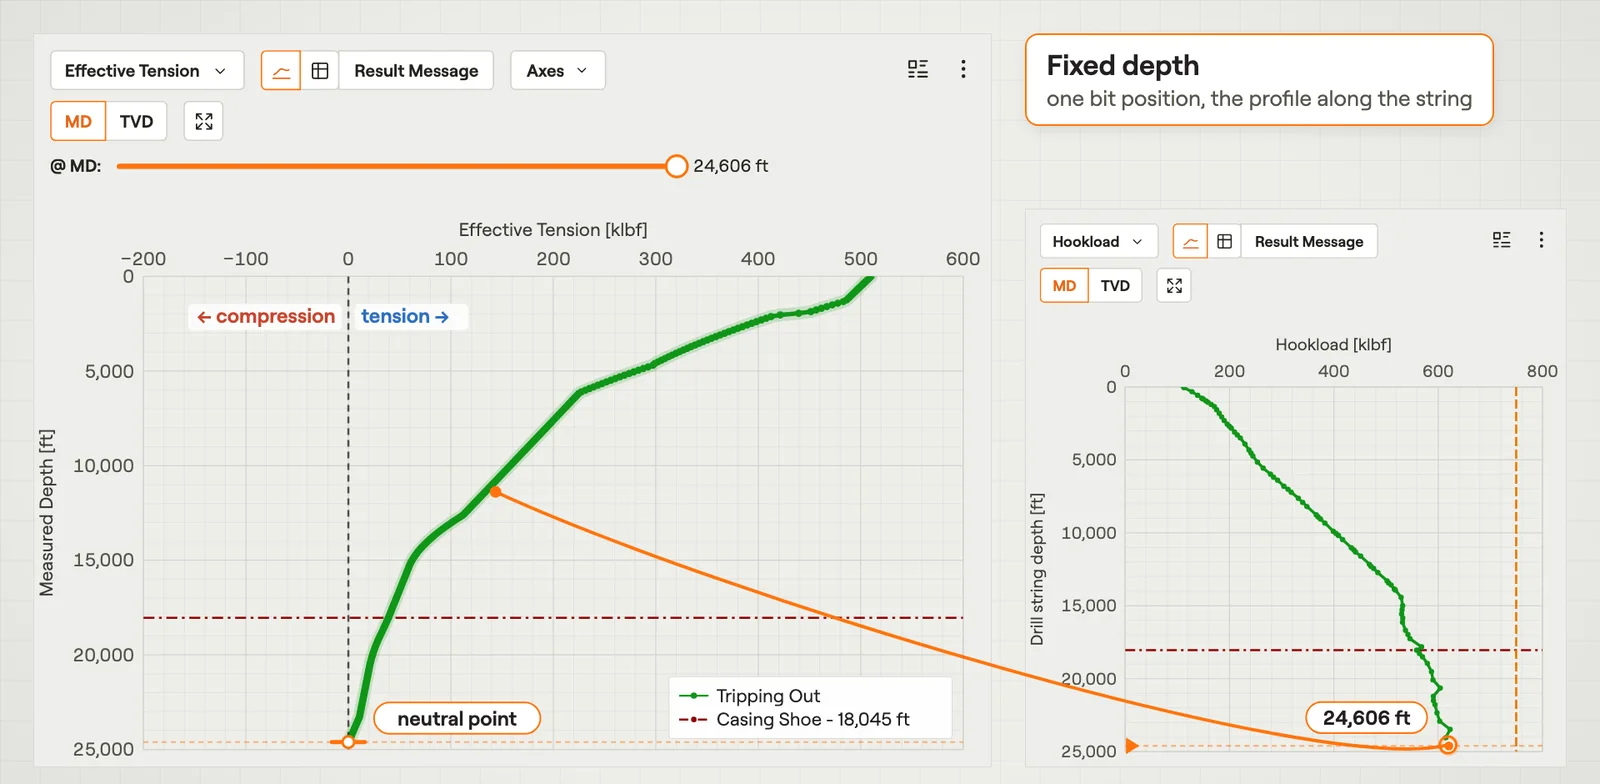 Effective TensionThe axial force along the string for one bit depth.Film · 3:04
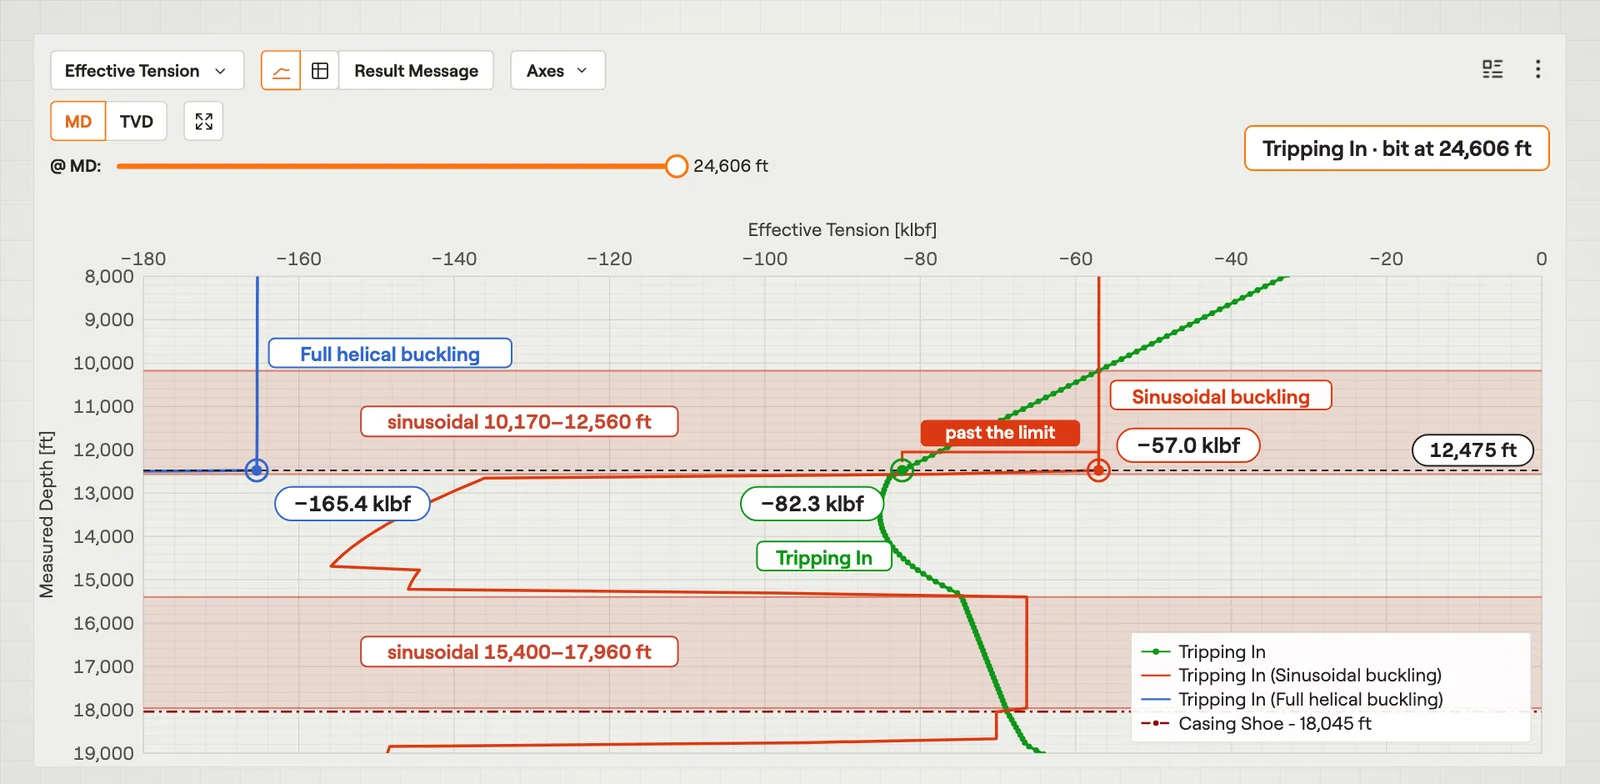 Buckling Limits & Minimum HookloadWhere and at which bit depth the string can buckle.Film · 3:26
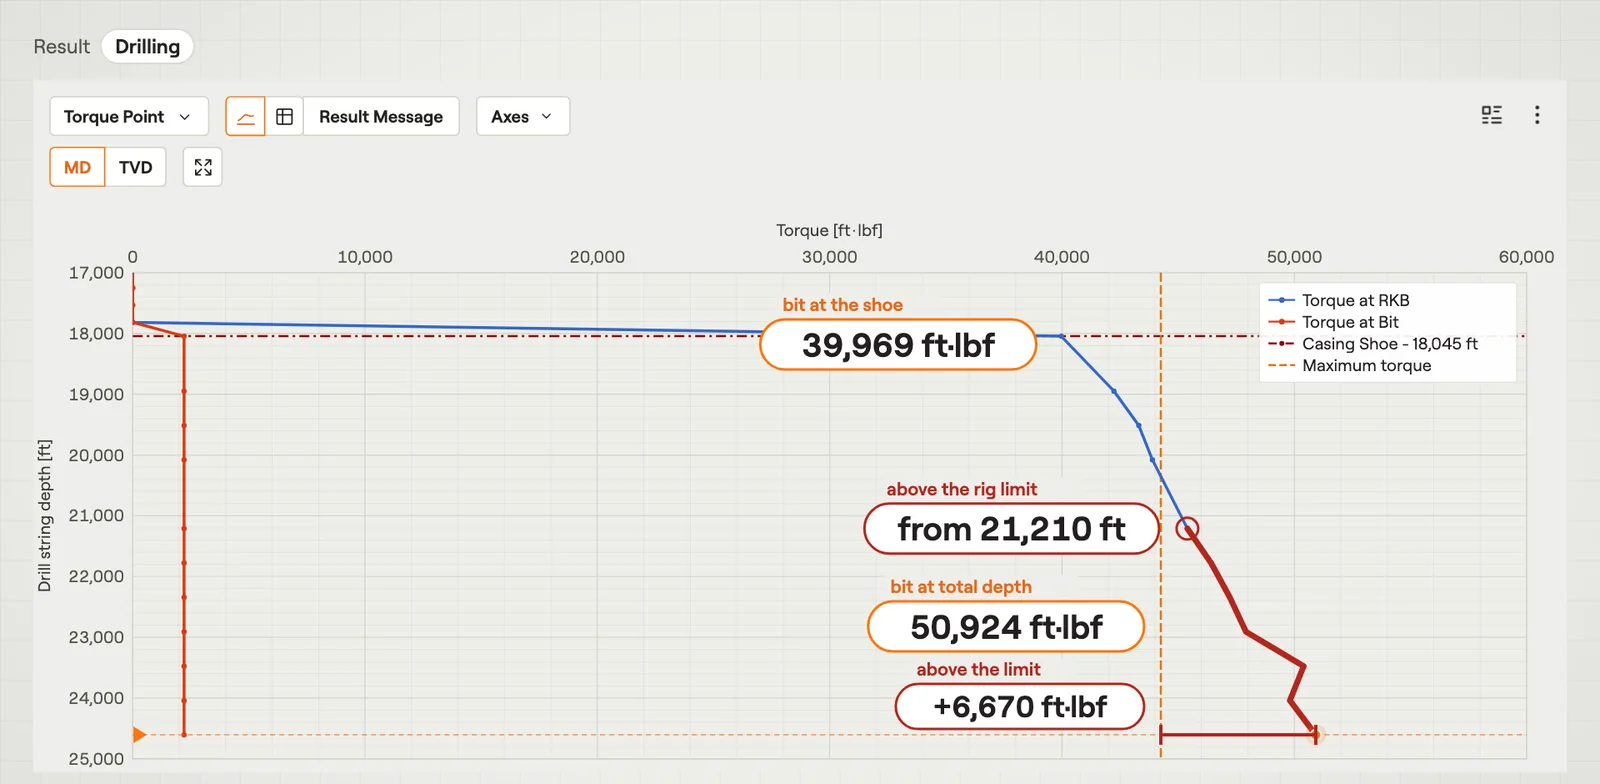 TorqueThe torque needed to rotate the string, at surface and along the string.Film · 3:02
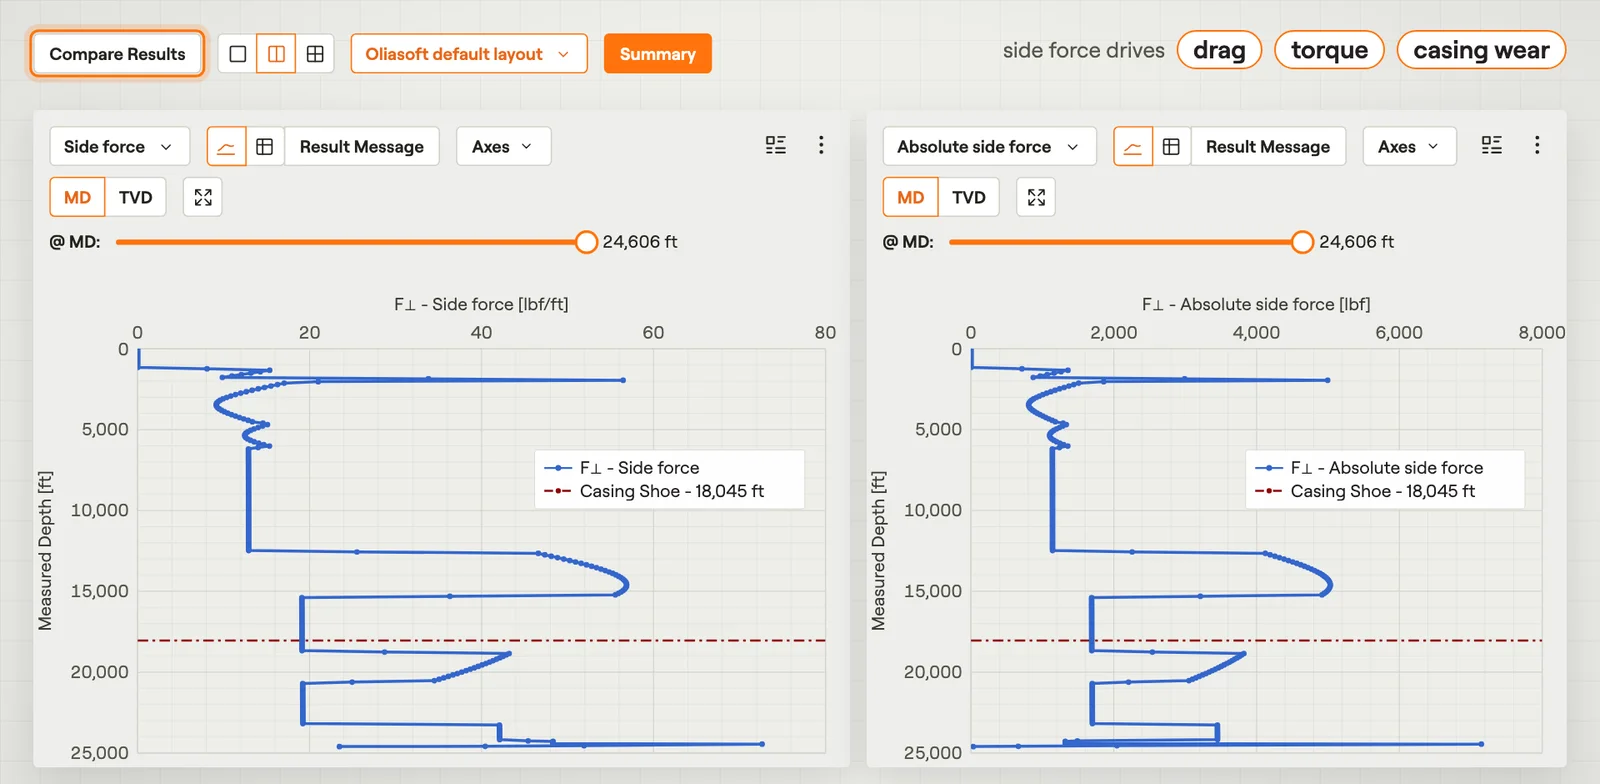 Side ForceThe contact force between the string and the wall of the hole.Film · 3:05
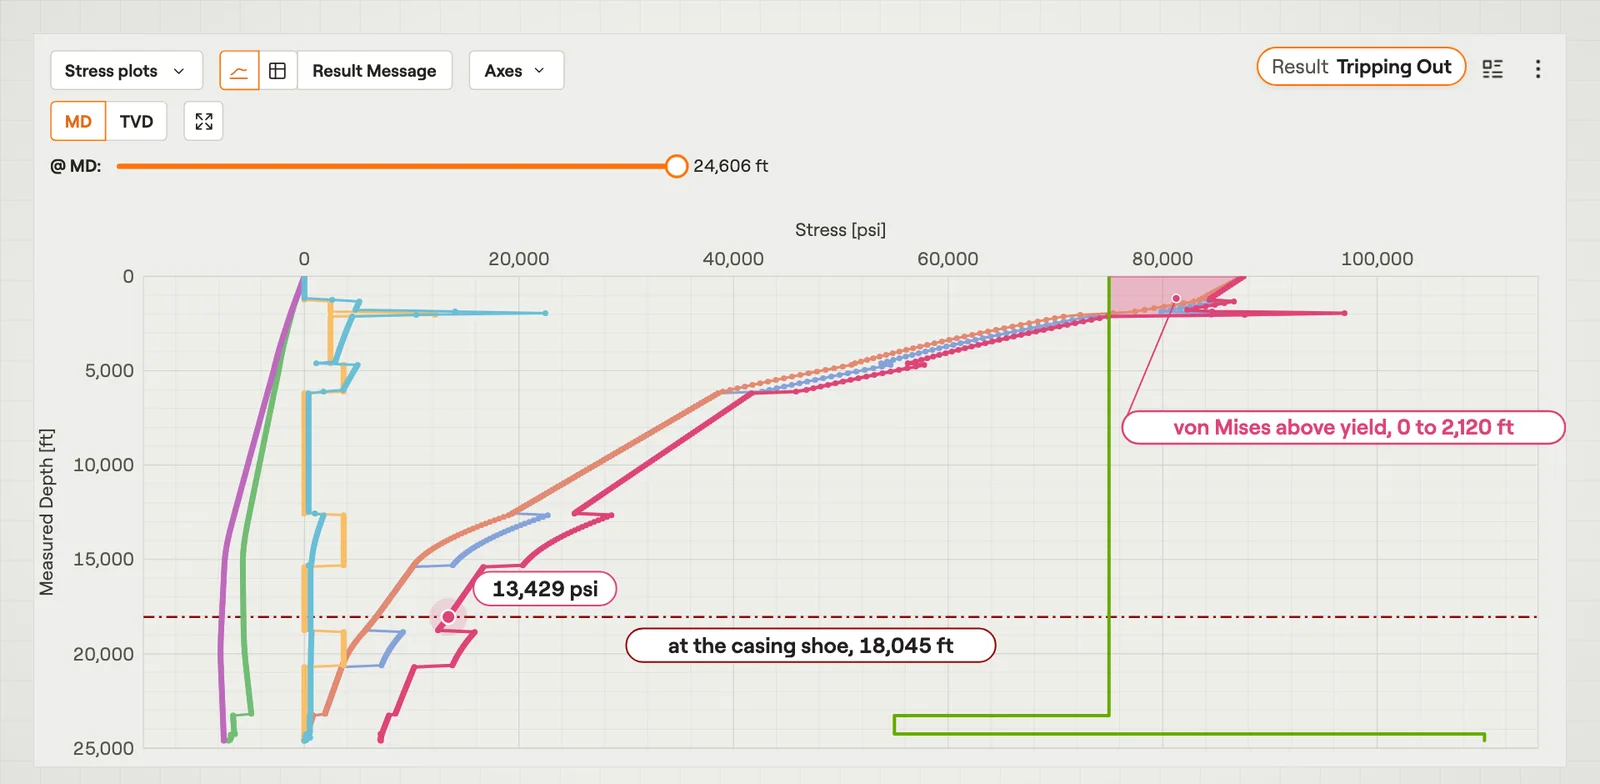 Stress PlotsThe stresses in the pipe wall along the string, against the yield strength.Film · 3:12
Hydraulics
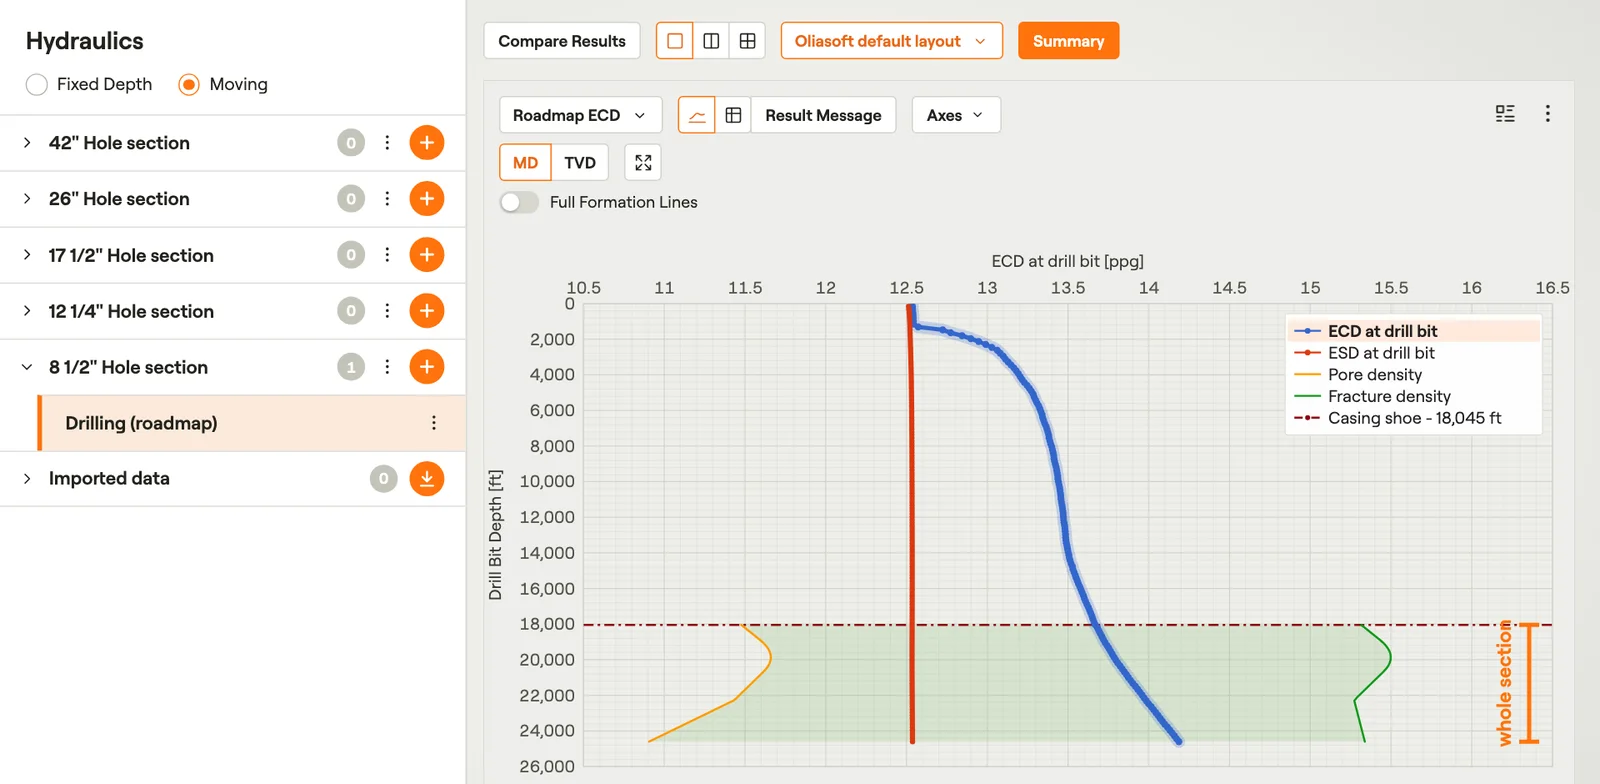 Roadmap ECDECD and ESD at the bit for each bit depth, against pore and fracture.Film · 3:38
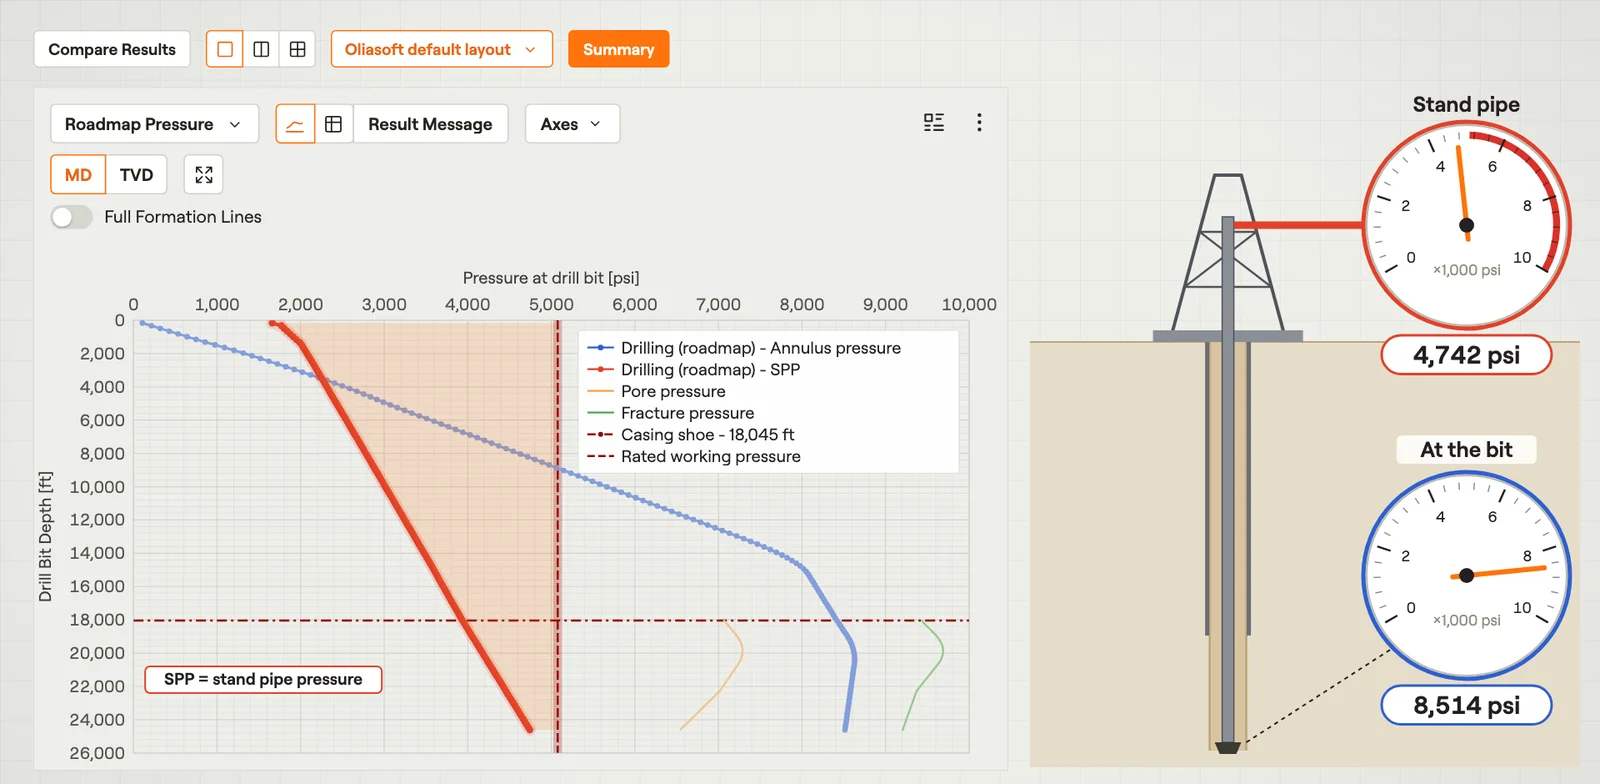 Roadmap PressureAnnulus pressure at the bit and stand pipe pressure for each bit depth.Film · 3:09
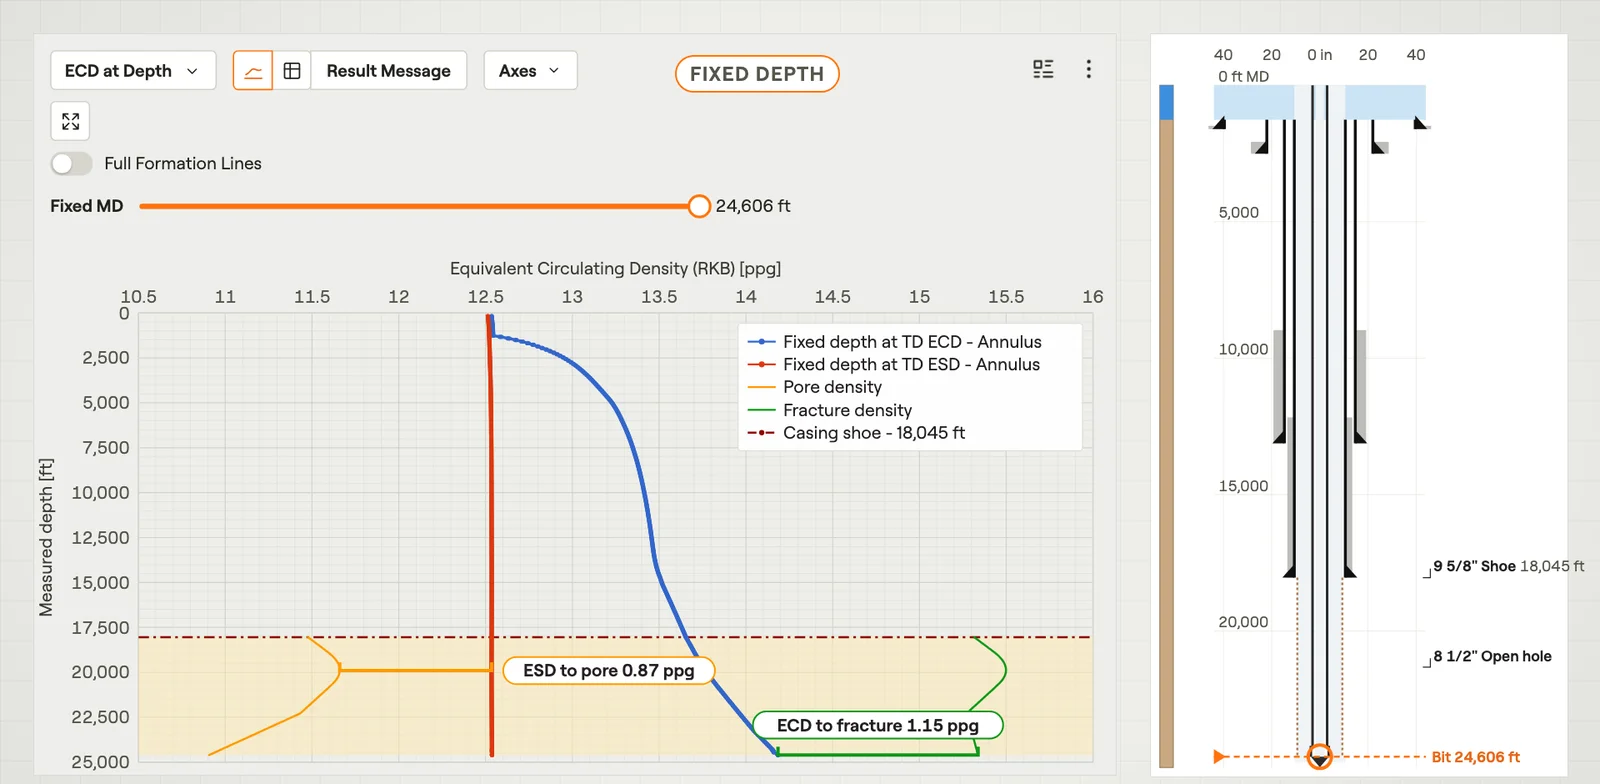 ECD at DepthECD and ESD along the annulus for one bit position.Film · 3:19
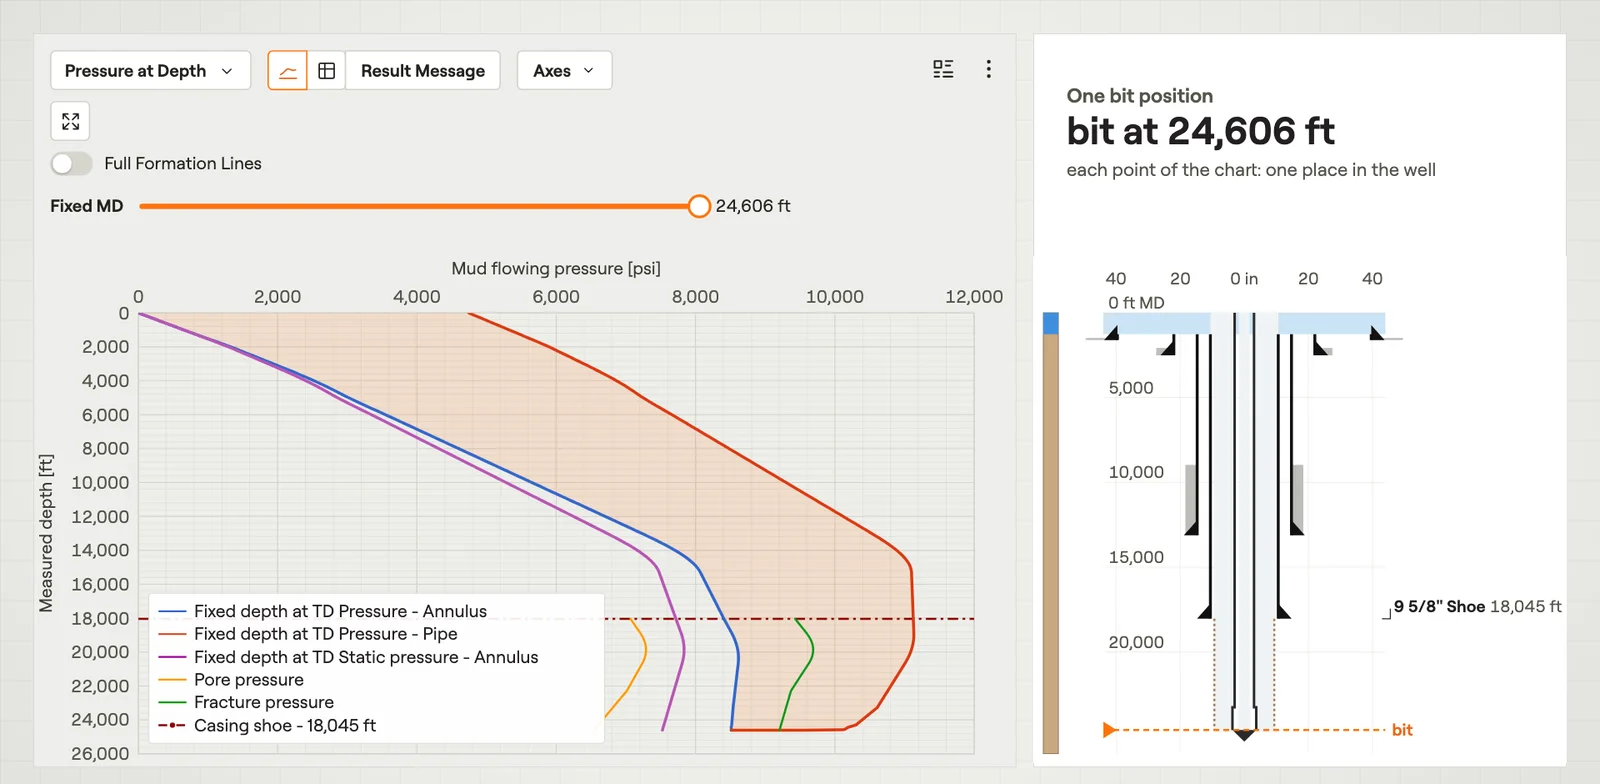 Pressure at DepthPressure inside the string and in the annulus along the well.Film · 3:28
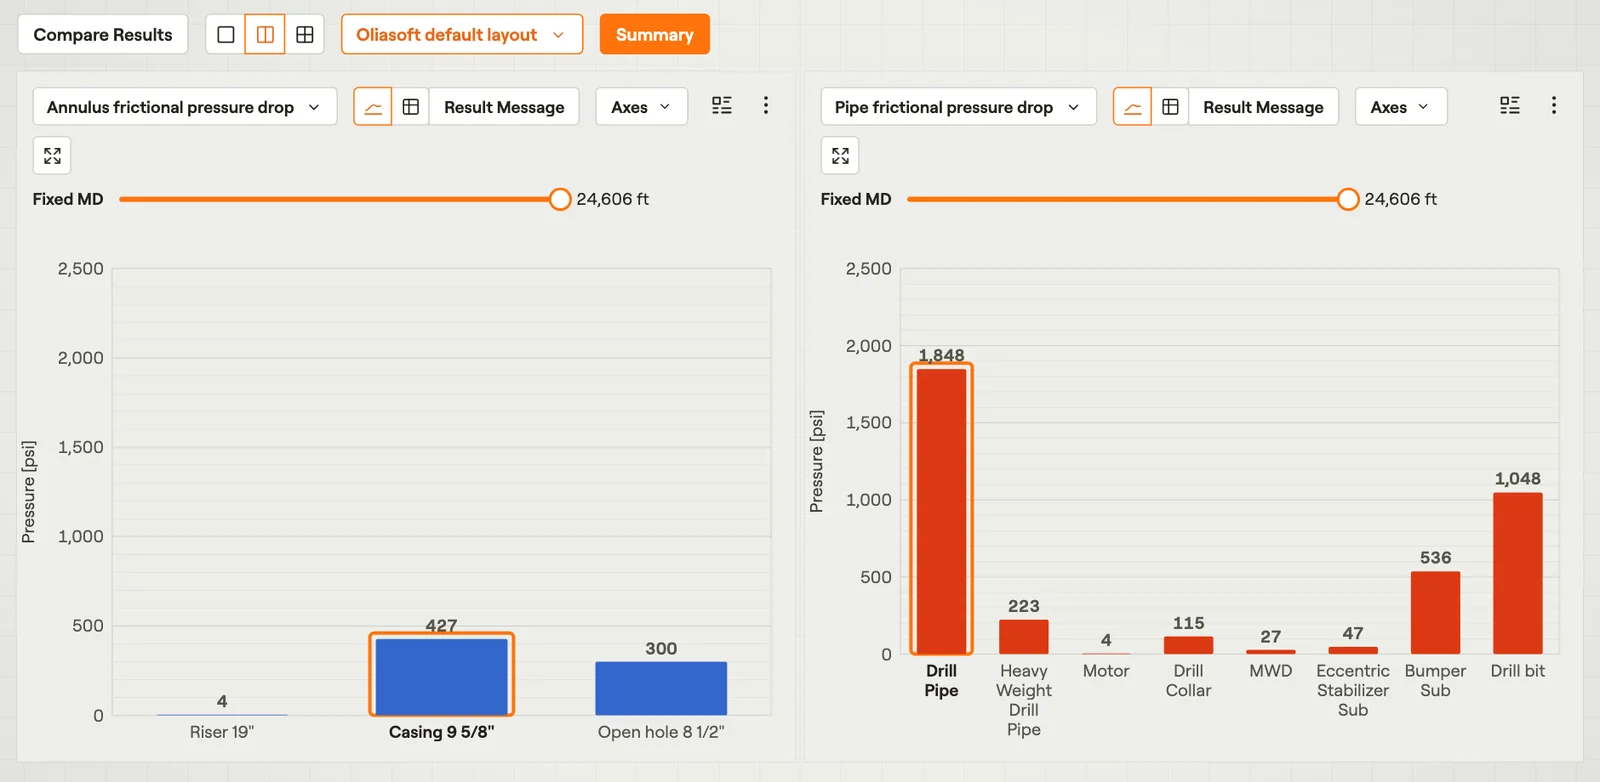 Frictional Pressure DropThe pressure lost to friction in each section of the flow path.Film · 3:34
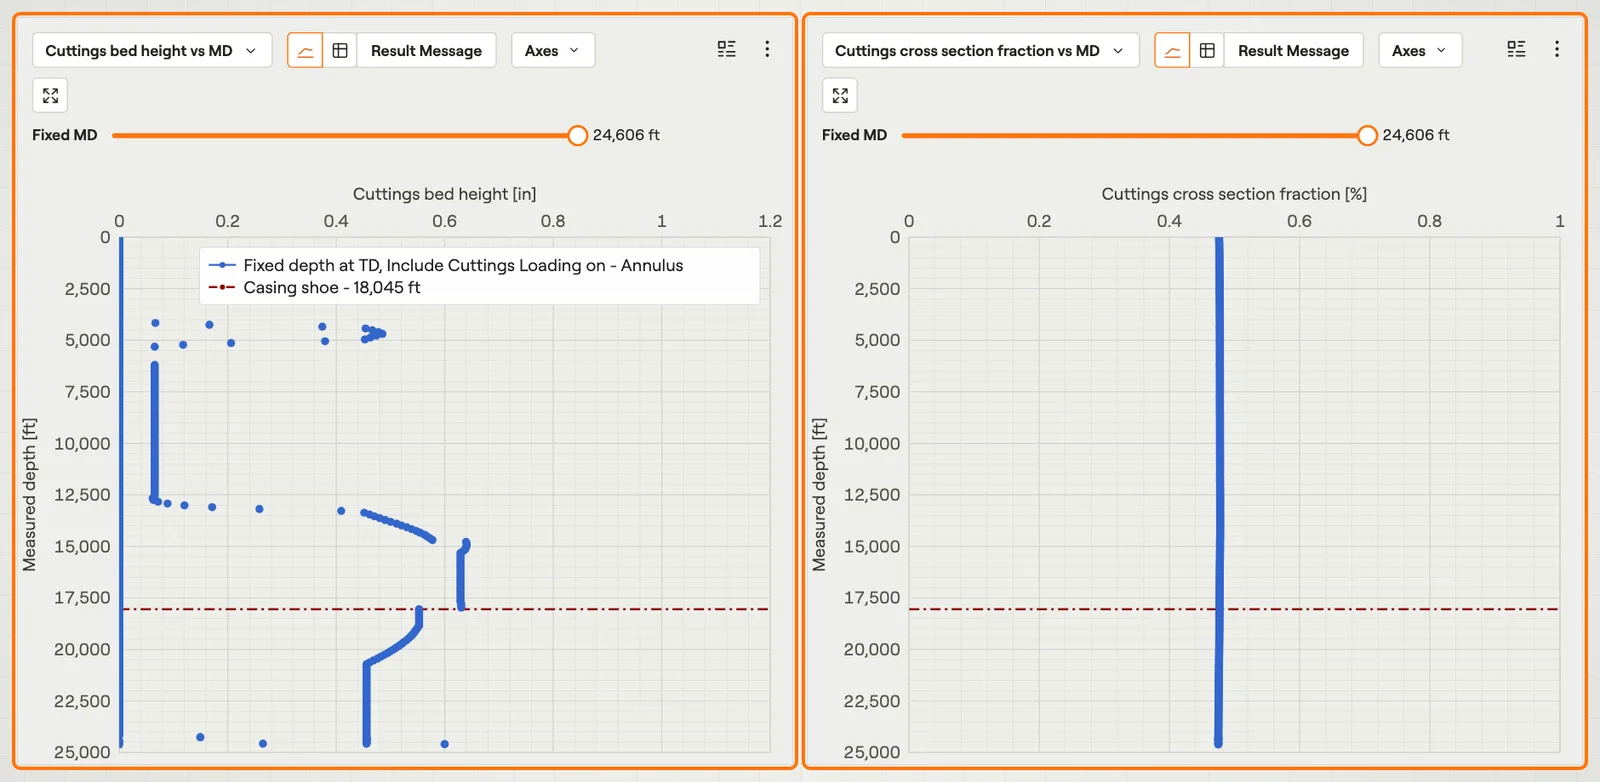 Hole CleaningThe height of the cuttings bed and the cuttings fraction along the well.Film · 3:21
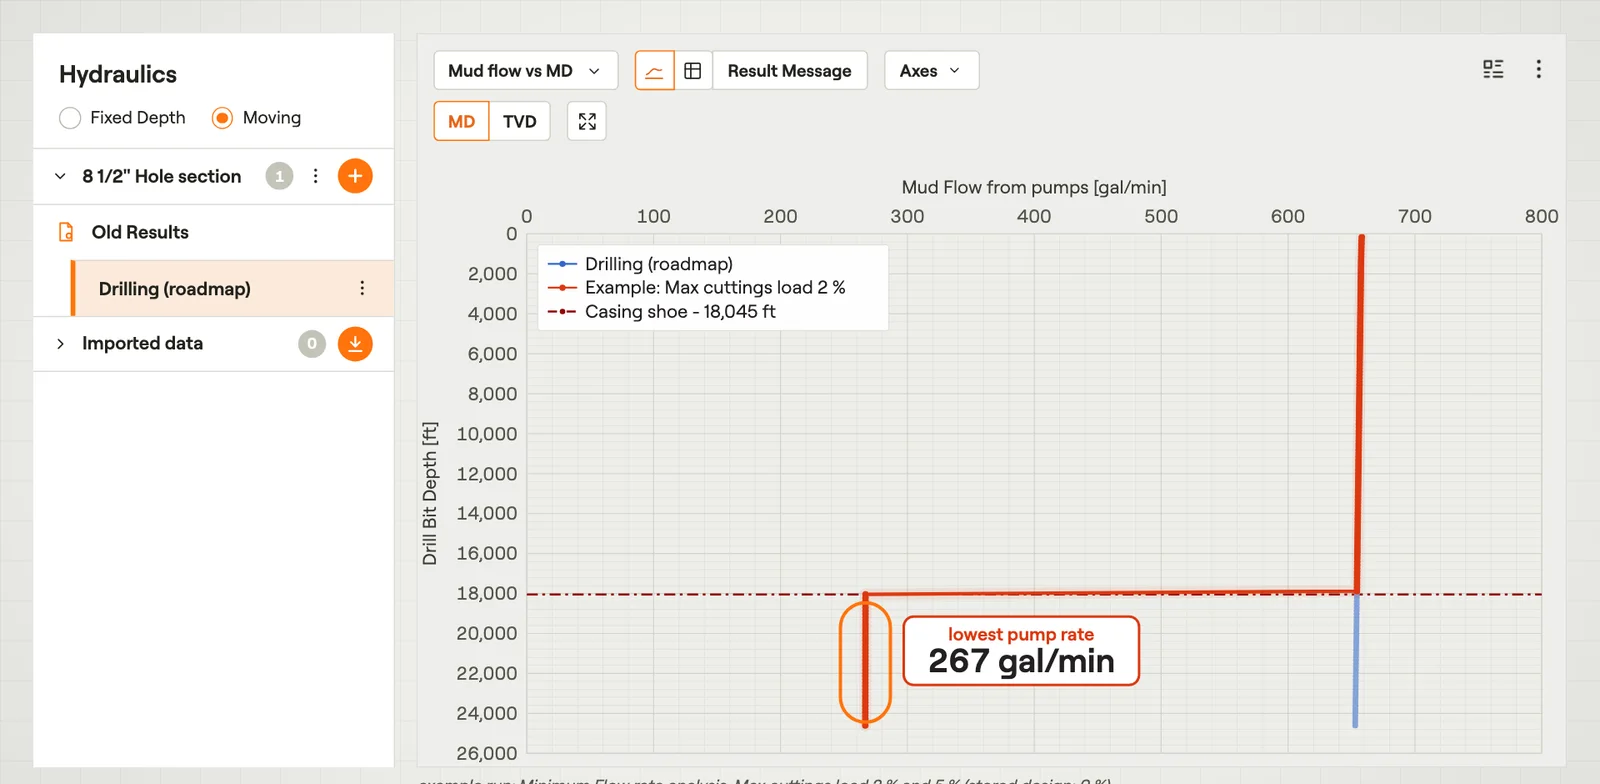 Mud Flow vs MDThe pump rate for each bit depth, including the minimum rate for hole cleaning.Film · 2:58
Surge & Swab
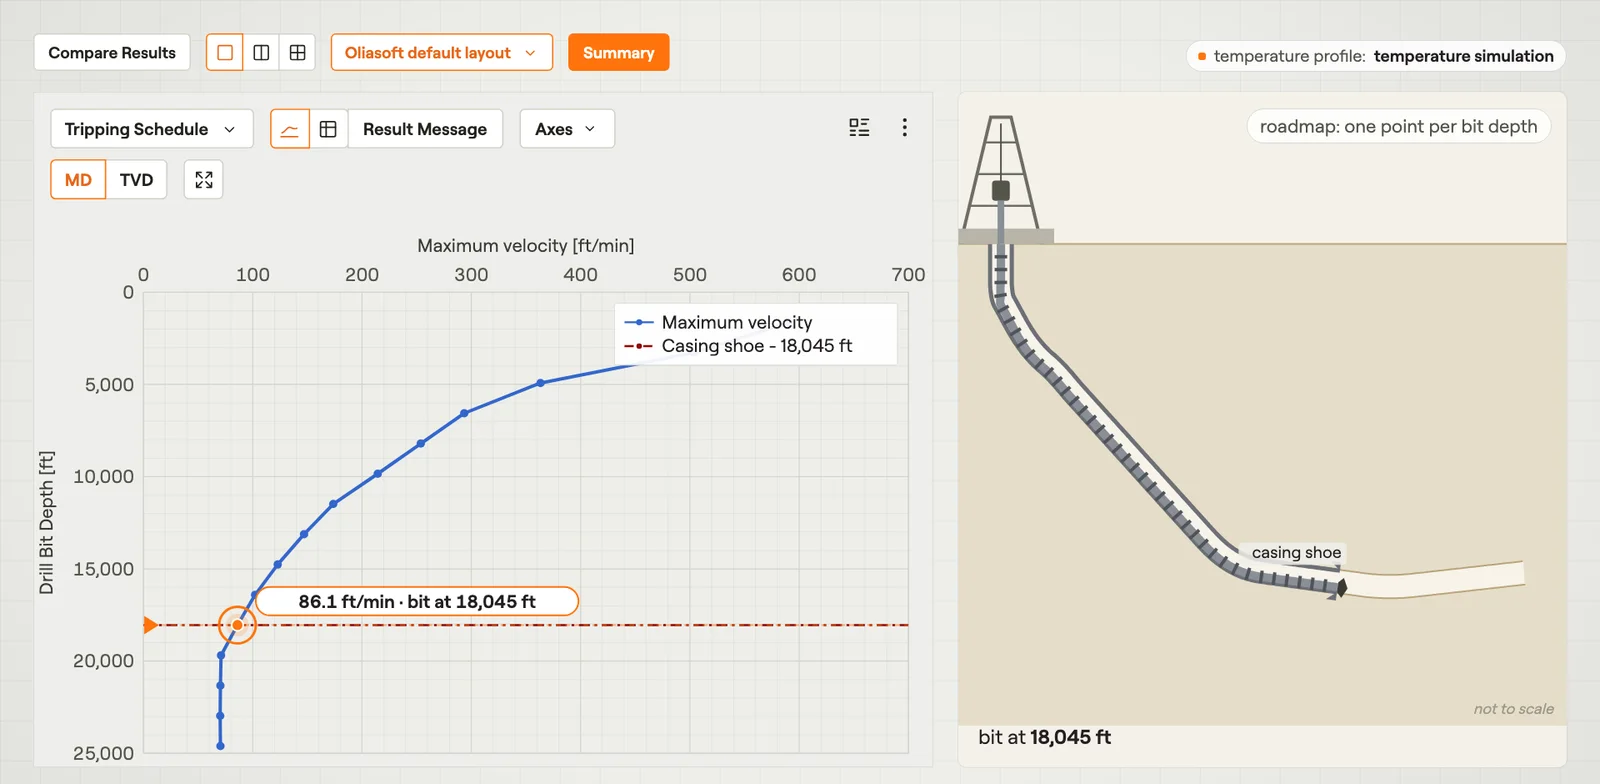 Tripping ScheduleThe highest steady tripping speed for each bit depth.Film · 3:08
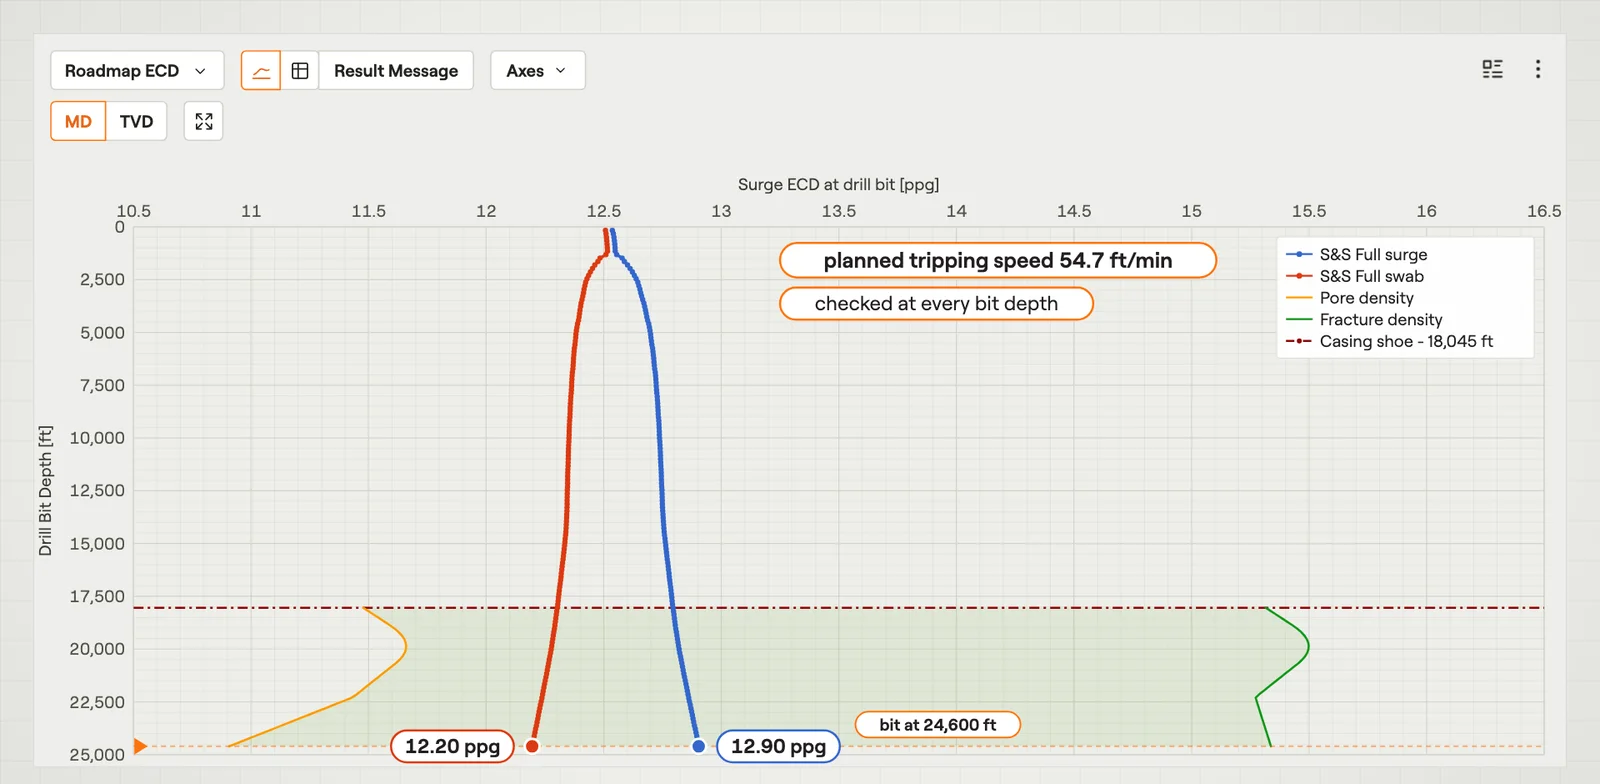 Surge & Swab RoadmapECD at the bit while tripping at one fixed speed.Film · 3:19
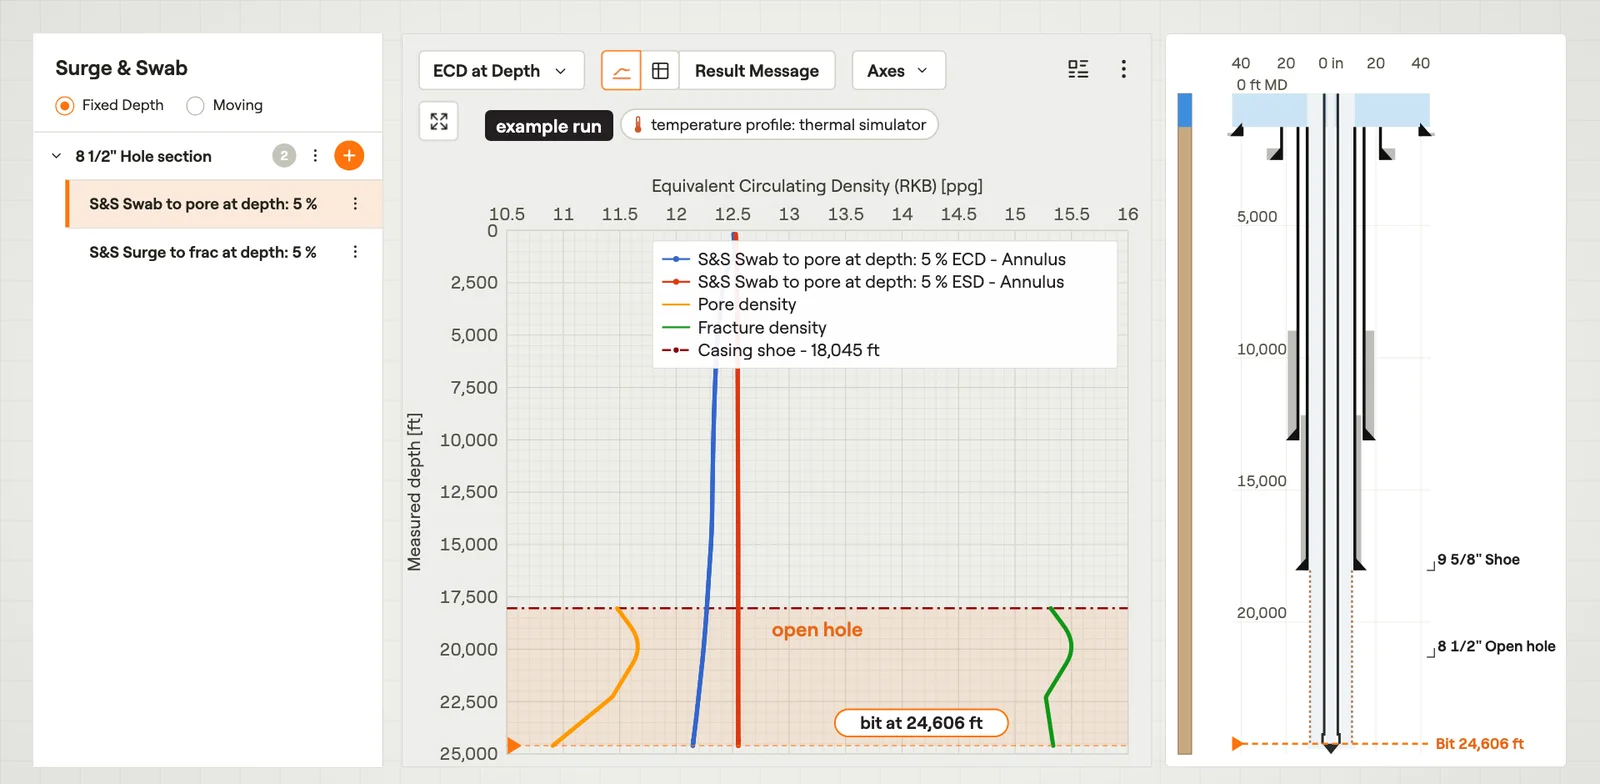 Surge & Swab at DepthECD, ESD or pressure along the annulus for one string position.Film · 3:37
Fluid Train
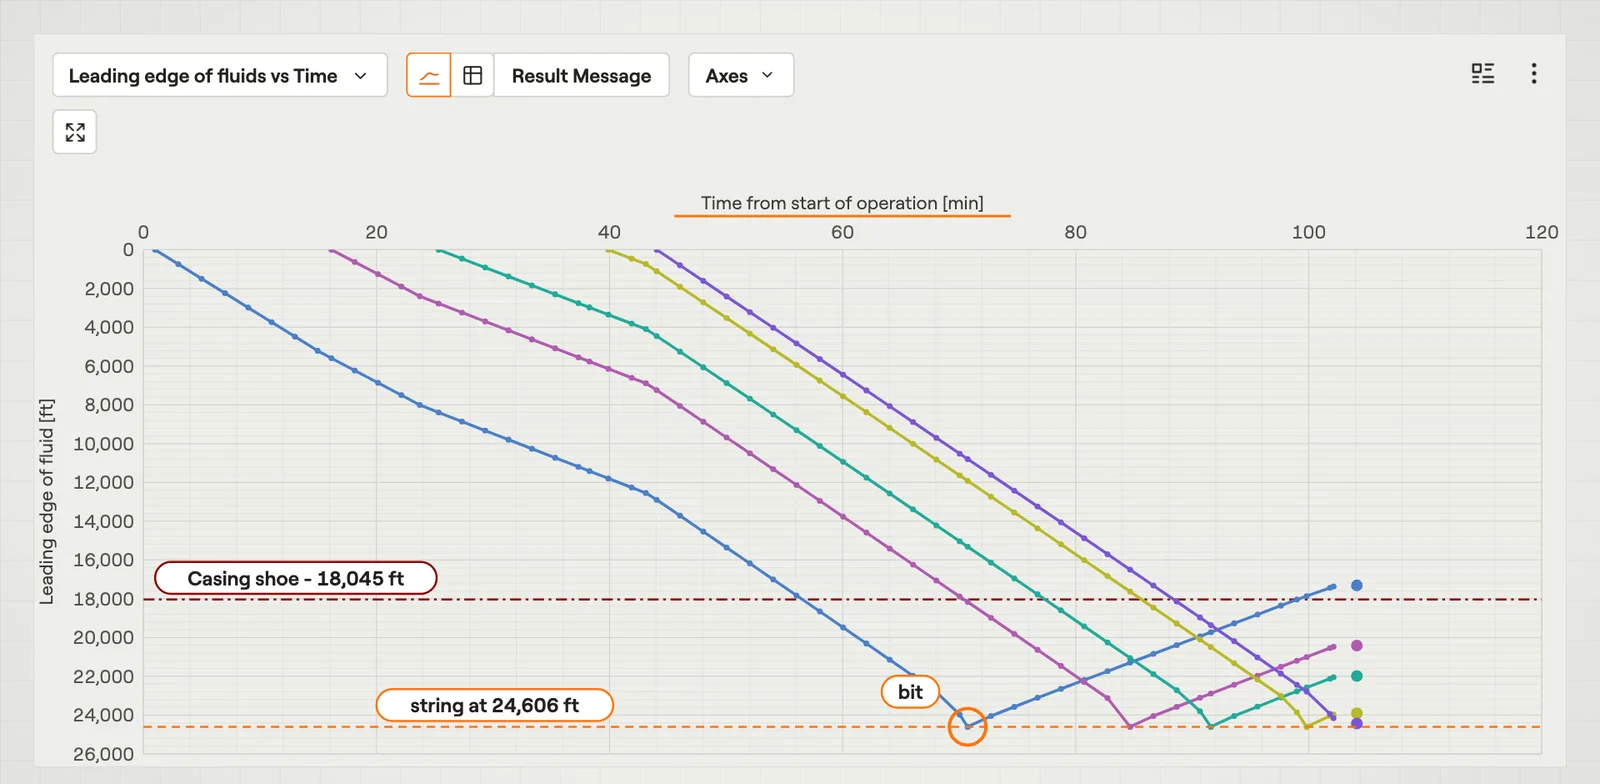 Leading Edge of FluidsWhere the front of each pumped fluid is, against time.Film · 2:56
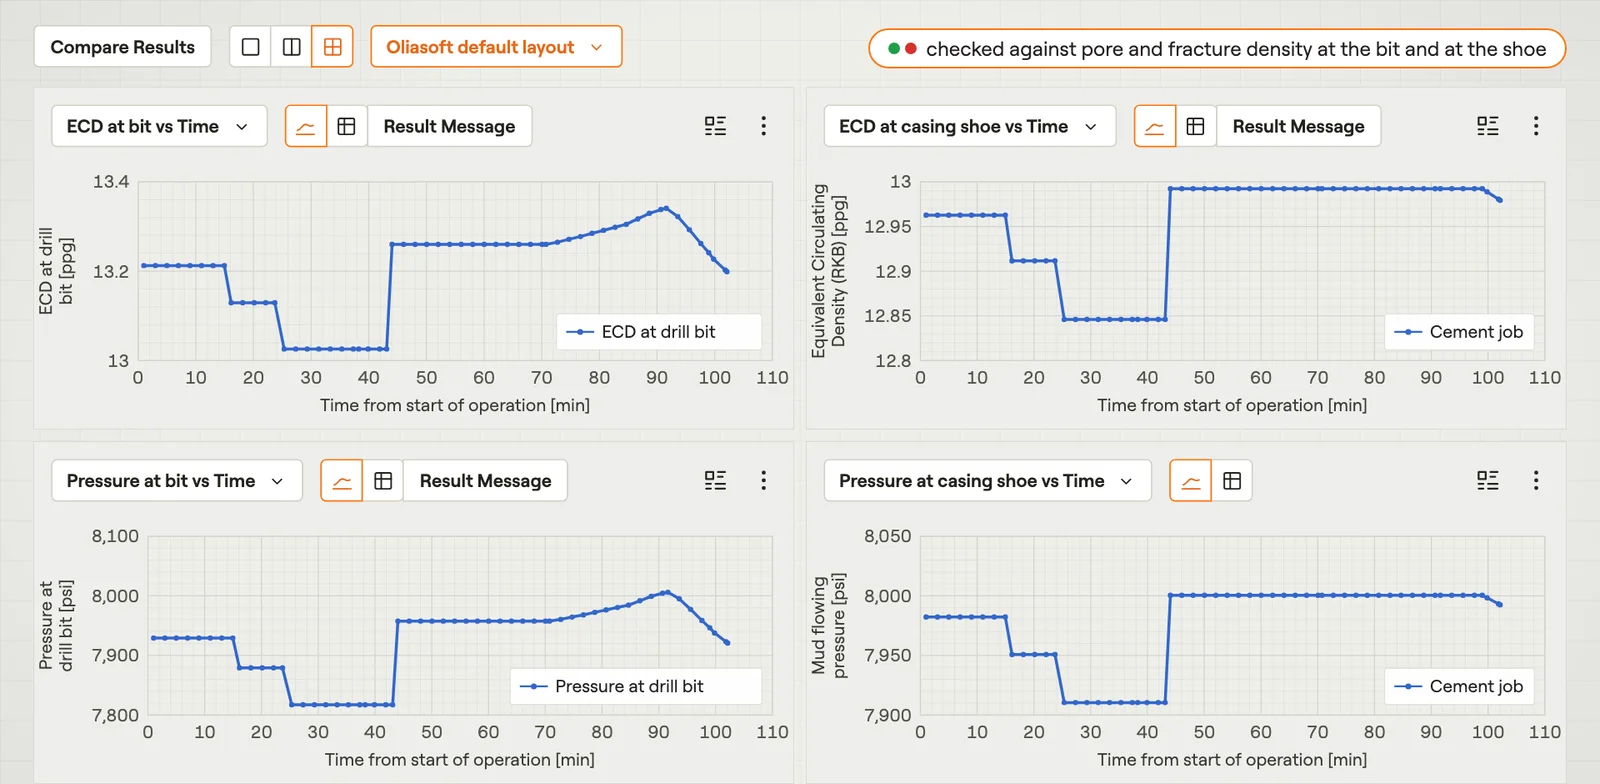 ECD & Pressure vs TimeECD and pressure at the bit and at the casing shoe during pumping.Film · 3:17
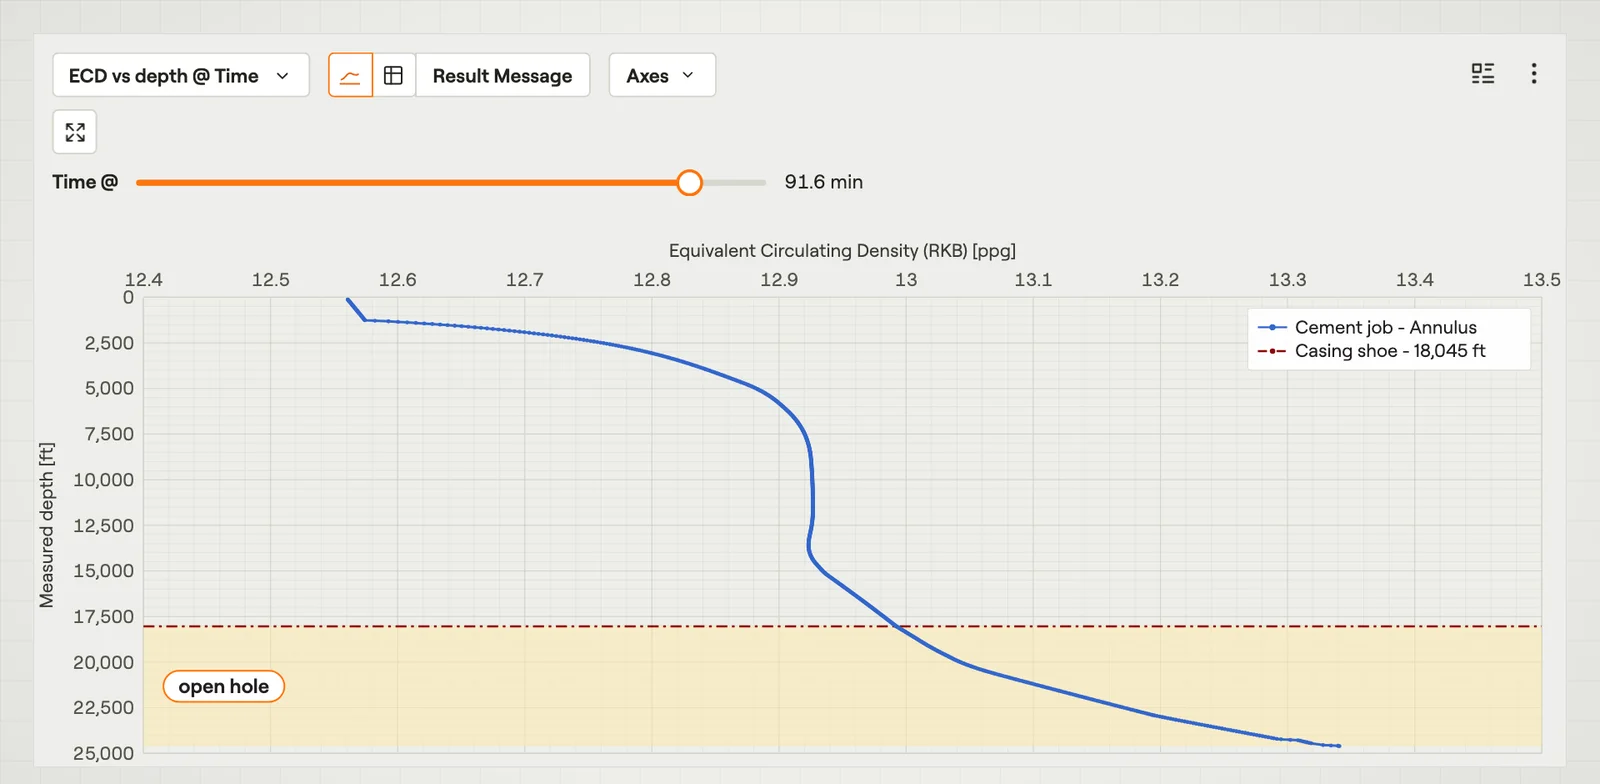 ECD vs Depth at TimeECD along the annulus at one time step of a pumping operation.Film · 2:51
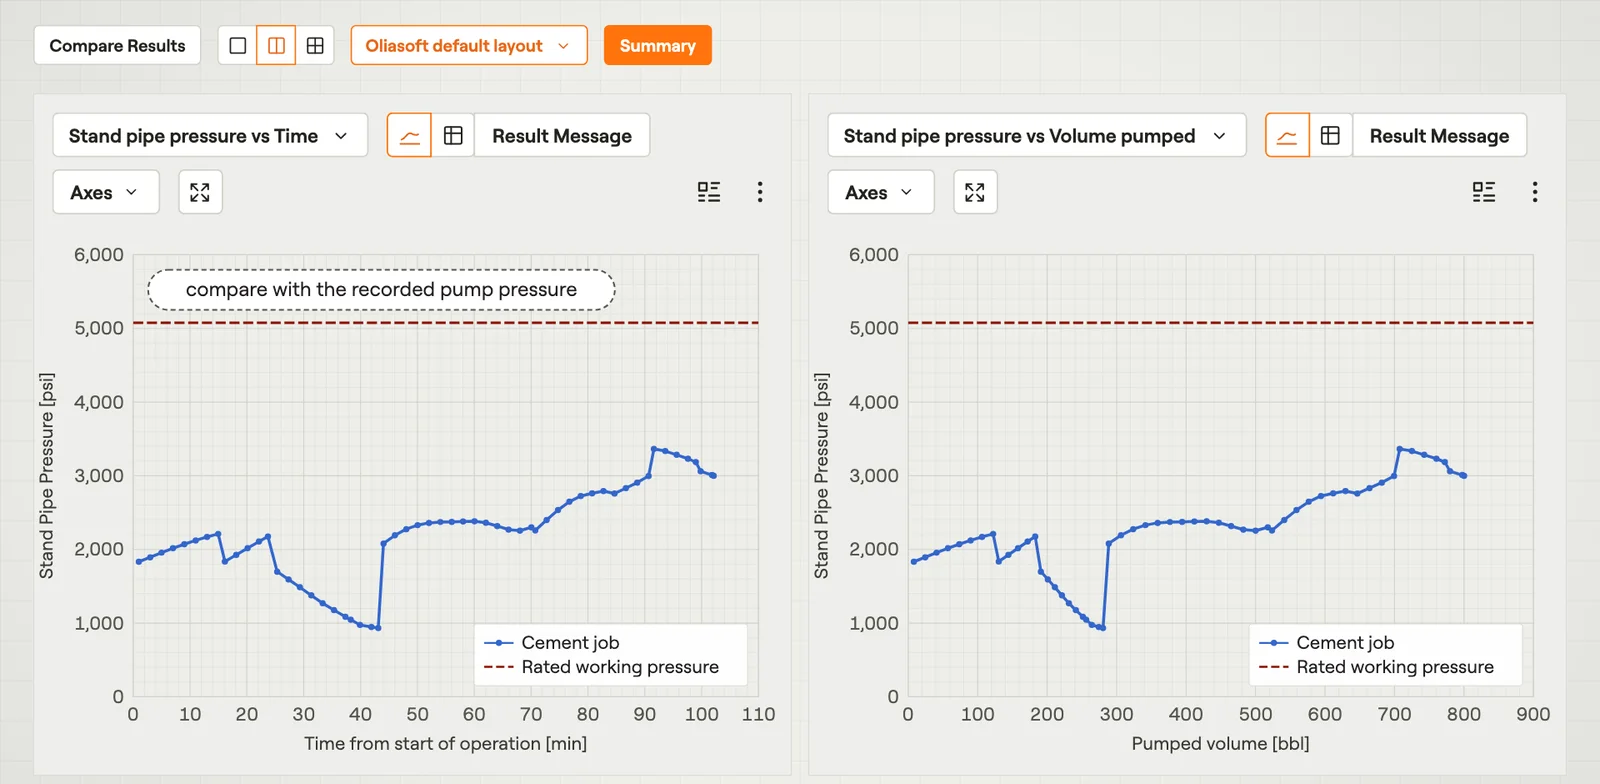 Stand Pipe PressureStand pipe pressure against time and against volume pumped.Film · 3:05
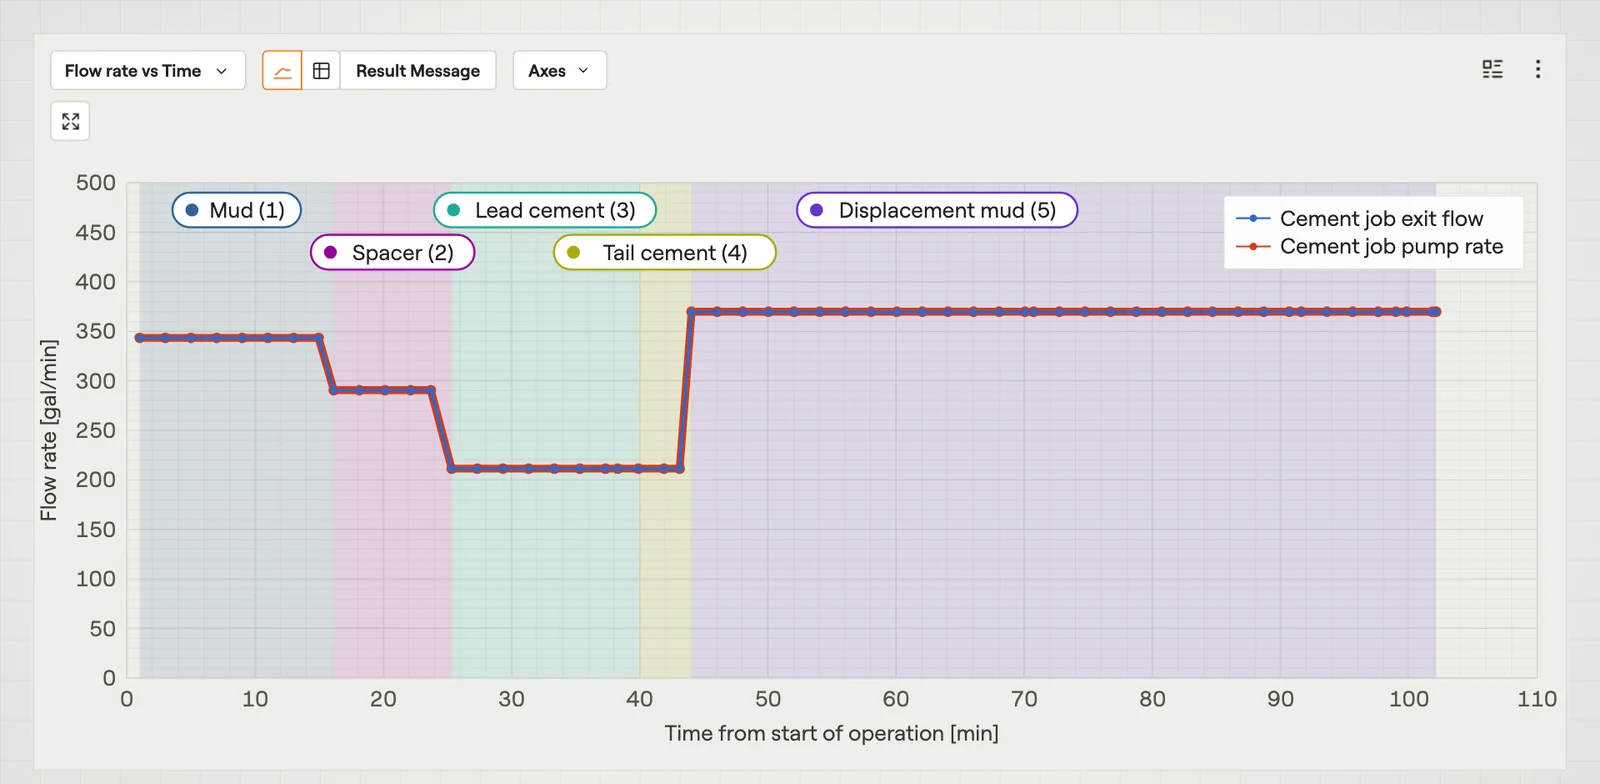 Flow Rate vs TimeThe pump rate into the string and the exit flow out of the annulus.Film · 2:39
Casing Wear
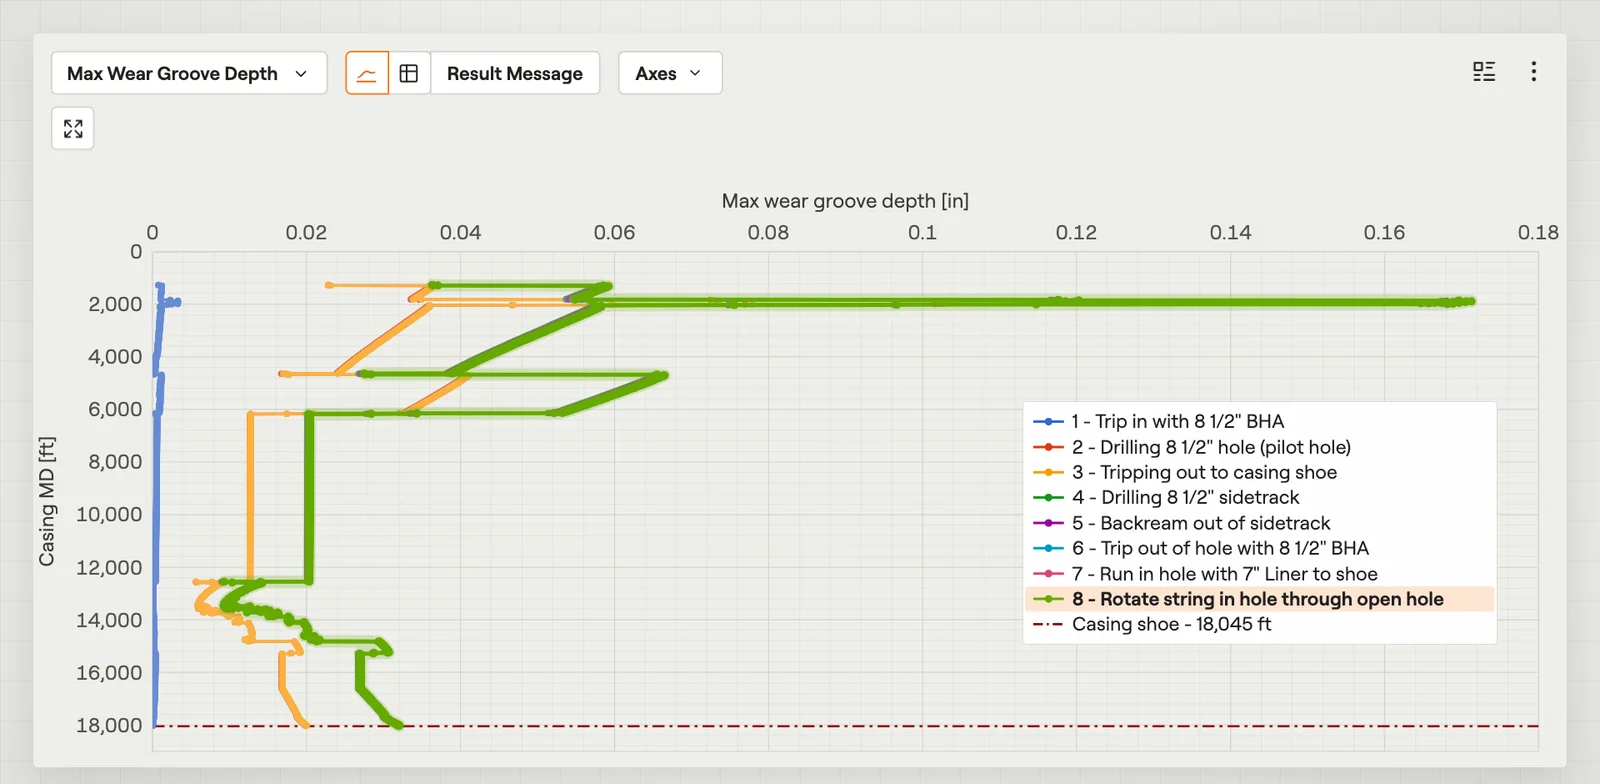 Max Wear Groove DepthThe depth of the deepest wear groove in each casing segment.Film · 3:01
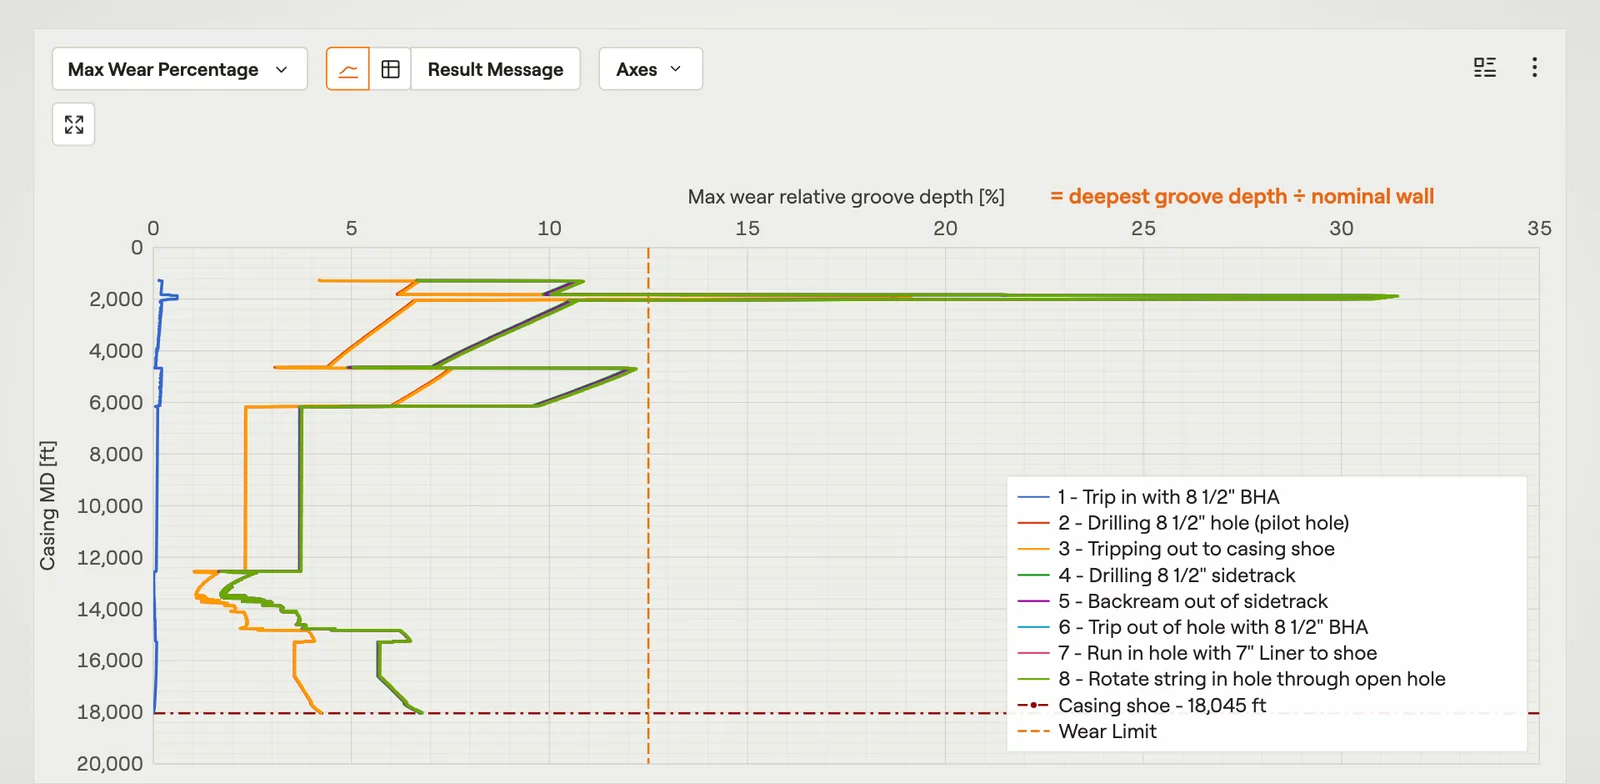 Max Wear PercentageThe wear as a percentage of the casing wall, against the wear limit.Film · 2:40
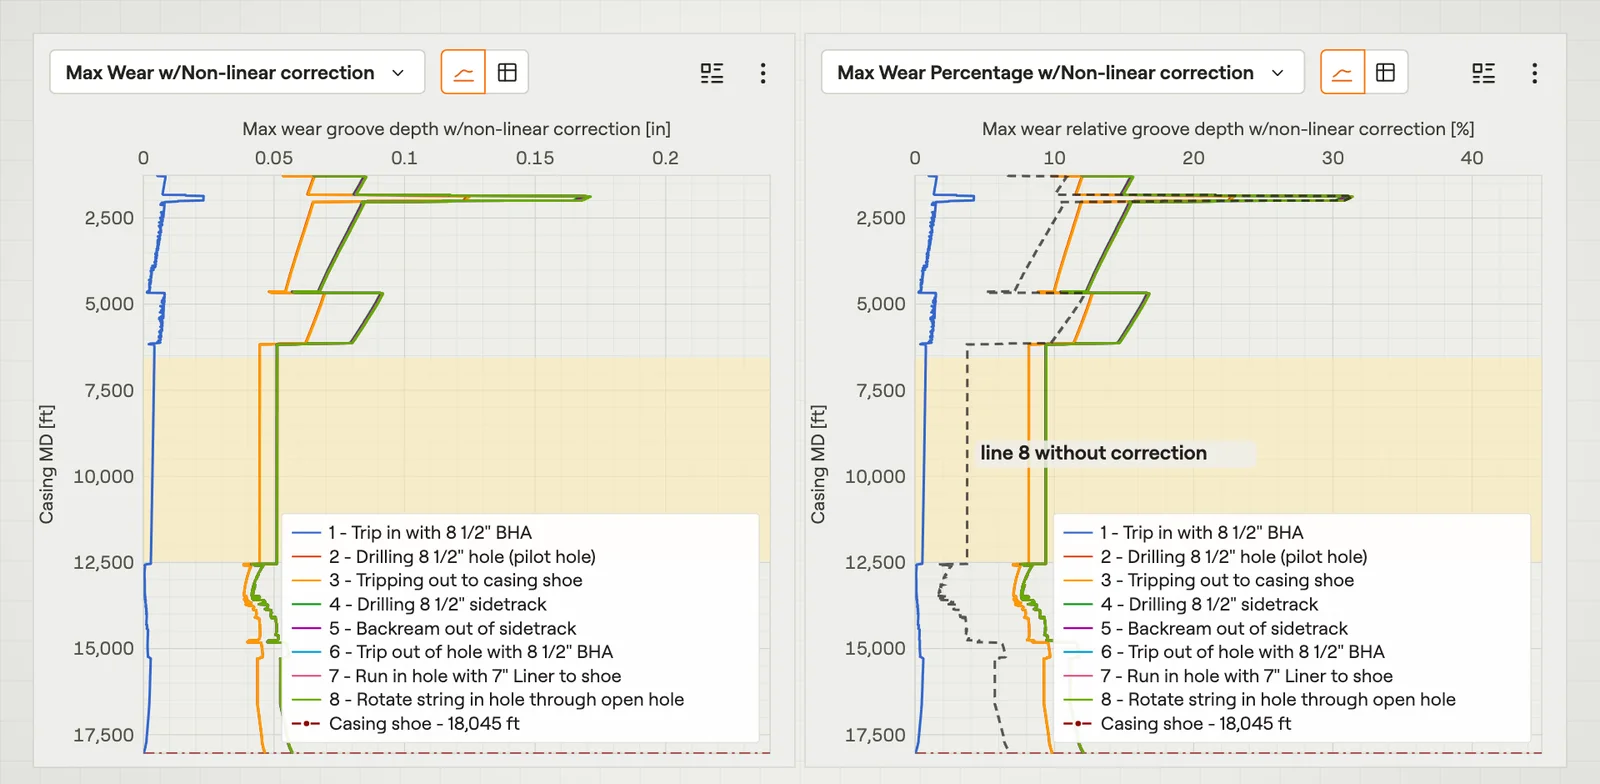 Non-linear Wear CorrectionThe wear after an empirical correction for shallow grooves.Film · 2:32
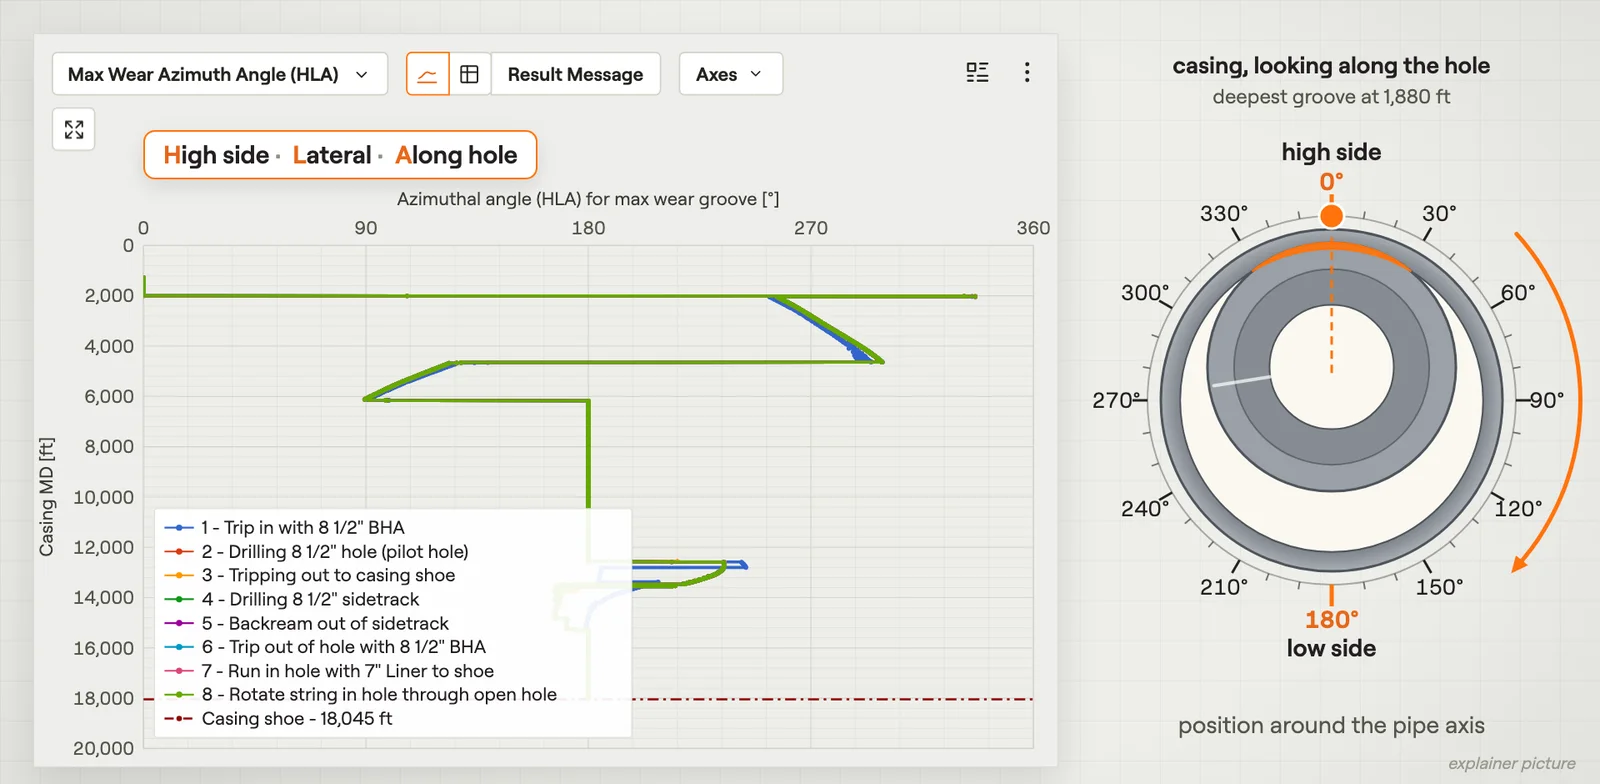 Max Wear Azimuth AngleWhere the deepest wear groove sits around the casing.Film · 2:51
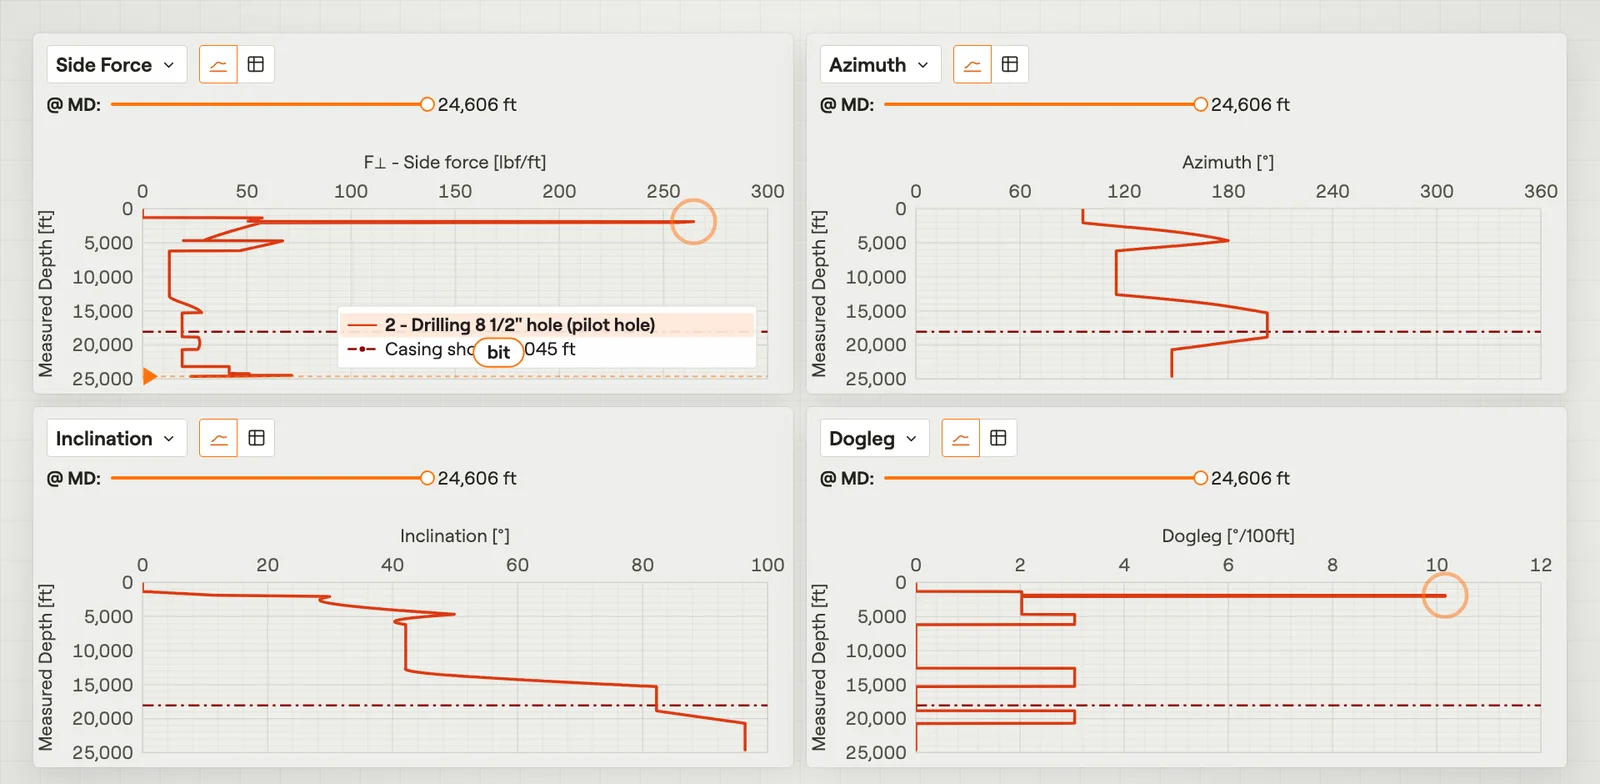 Side Force & Trajectory for WearThe side force and the well shape behind a wear peak.Film · 2:59