Charts
The result charts of Casing & Tubing Loads show the pressures, axial loads, movements, stresses and safety factors of each string for every load case. This page describes where they are and the conventions they share. Each chart has its own page with an animated example and an explanation film: see The charts.
In WellDesignCasing & Tubing LoadsResults
Where the charts are
All charts in this section are found in Casing & Tubing Loads → Results. The Results view shows the charts for the selected section (for example 13 3/8" Intermediate Casing) in a grid of panels. Each panel has a title dropdown that opens the chart menu: a main group (for example All, Axial, Burst, Collapse, Triaxial, Safety Factors), a chart in that group, and finally the load case to plot. The panel title is written as <group> - <chart>, for example All - Differential Pressures or Axial - Loads wo/bending.
The last menu level is the load-case selection: All Load Cases, Initial Conditions, or a single load case. Some charts add their own entries at that level, such as Burst Rating and Collapse Rating on Differential Pressures, or Axial load line on the axial loads charts.
When service loads are active, the Burst and Collapse groups are replaced by a Service group with the same pressure charts, load lines and safety factors.
Shared conventions
Depth axis
Depth charts have depth on the vertical axis, increasing downwards, titled Depth MD [ft]. Use the Axes popover to switch to TVD. Calculations are done on a measured-depth grid along the string, and hydrostatic pressures are integrated over true vertical depth. A fluid column is therefore a straight line in TVD, but on an MD axis its slope changes where the well builds angle.
Value axis
On depth charts the value axis is at the top of the chart. Its title is the chart name followed by the unit, for example Differential Pressures [psi]. Units follow your unit settings and can be changed per chart in the Axes popover. The examples in this section use US oilfield units: psi, klbf, ft, in, °F and ppg.
Sign conventions
| Quantity | Positive | Negative |
|---|---|---|
| Axial force | tension | compression |
| Differential pressure | burst (internal pressure higher) | collapse (external pressure higher) |
| Movement / length change | downward (elongation) | upward (shortening) |
| Effective force for buckling | compression (see Buckling) | tension |
Reference state
Ballooning, piston, thermal and restoring forces and movements are changes from the Initial Conditions: the state after the string has been run, cemented and, where applicable, after the packers have been set. See Initial Conditions and Axial Loads.
Colours and line styles
| Element | Style | Meaning |
|---|---|---|
| Load case | solid line in the load case's colour | One curve (or point trail, or bar) per load case. Colours come from a fixed 20-colour palette, assigned in the order of the section's load-case list, so within a section a load case keeps its colour on every chart. |
| Initial Conditions | grey | The reference state. Drawn 3 px wide on Differential Pressures. |
| Loads from a liner | dashed, load-case colour | Load cases carried over from another section, typically a liner below: the section number in the load case's short name differs from the selected section. Dashed on the per-load-case line charts. |
| Pipe rating | red, dashed | Burst, collapse, tension and compression ratings. Shown without temperature deration. |
| Design factor | green, vertical, labelled <Type> Design Factor (value) | The minimum acceptable safety factor for that check. |
| Design Line | black | Worst load at each depth multiplied by the design factor (Burst and Collapse groups). |
Ratings and temperature deration
Rating lines are drawn at their room-temperature values, and the panel shows the note Pipe rating is displayed without temperature deration. They do not depend on a load case, so they are constant within a pipe section and step where the pipe changes. The safety factors use the yield strength derated at each load case's temperature, at each depth. A load line inside the rating line can therefore still have a safety factor below the design factor where the pipe is hot. Use the safety factor charts for the design decision.
Design factors
Design factors are set per design. The defaults are burst 1.10, collapse 1.1, axial tension and compression 1.25, and triaxial 1.25. On safety factor charts they are drawn as green vertical lines. When Normalized Safety Factor is selected in the Axes popover, each safety factor is divided by its design factor and the design factor lines are hidden. Every limit is then at 1.
Panel features
| Feature | What it does |
|---|---|
| Layout | 1, 2 or 4 panels. |
| Templates | Save and load a layout of charts. The global default template Oliasoft default layout shows All - Differential Pressures, Axial - Loads wo/bending, Triaxial - Von Mises Stress and Safety Factors - Min Pipe/Connection - Minimum Safety Factors (with All selected). Company and user templates can be added. |
| Loads mode | All loads, Single load or Selected loads, with a load-case picker. Some charts change in single-load mode (Combined Pressure plot, component bars on Total Length Change). |
| Chart / table | Switches between the chart and its table. The table can be exported to CSV, with units set per column. Table-only charts (Piston - Force, Restoring force) have no chart view. |
| Axes | MD/TVD depth, axis units, axis ranges and reset, Normalized Safety Factor on safety factor charts, and the line style (points, lines, or points and lines). |
| Pipe Rating | Shows or hides the red dashed rating lines on Differential Pressure(s) and on the axial loads charts. The default comes from the Pipe rating lines toggle in Settings → Casing Design → General. |
| String | Selects the string on the Von Mises Stress and Design Limit Plot charts. |
| Maximize | Opens the panel full size. |
| Zoom / pan | Drag to zoom, or switch to pan. Double-click resets the view. |
| Download | Saves the chart as PNG. |
| Legend | Show or hide the legend. It is hidden by default. |
| Hover | Highlights the depth on the well schematic. |
Notation
| Symbol | Meaning |
|---|---|
| , | internal and external pressure |
| differential pressure | |
| , , | outside diameter, inside diameter, wall thickness |
| , , | outside, inside and cross-sectional (steel) area |
| specified minimum yield strength | |
| , , | Young's modulus, Poisson's ratio, coefficient of thermal expansion |
| temperature deration factor (1 at ambient, below 1 when hot) | |
| , | design factor (requirement), safety factor (calculated) |
The charts
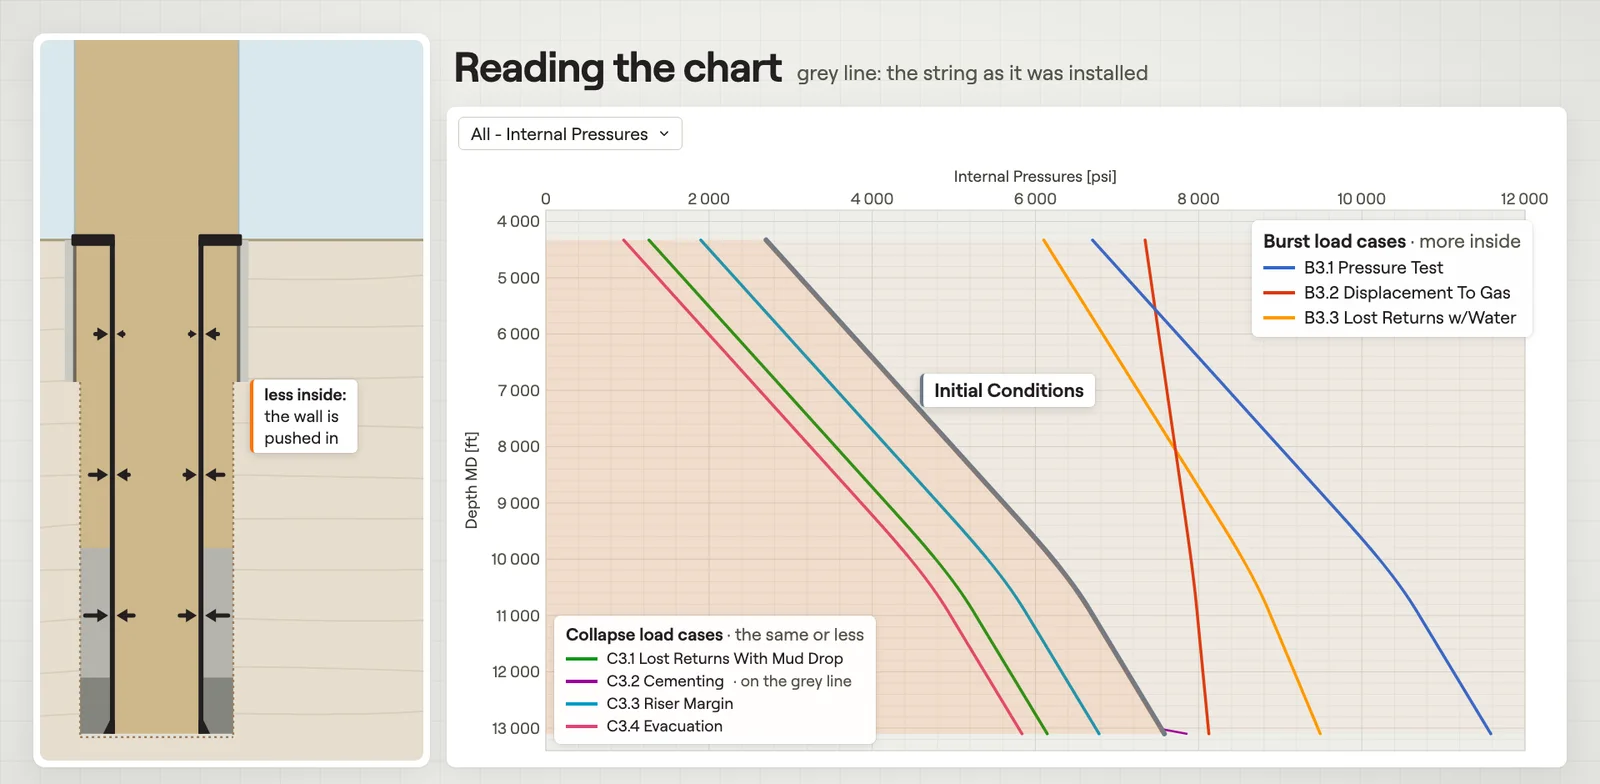 Internal & External PressuresThe pressure inside and behind the pipe against depth, one curve per load case.Film · 2:28
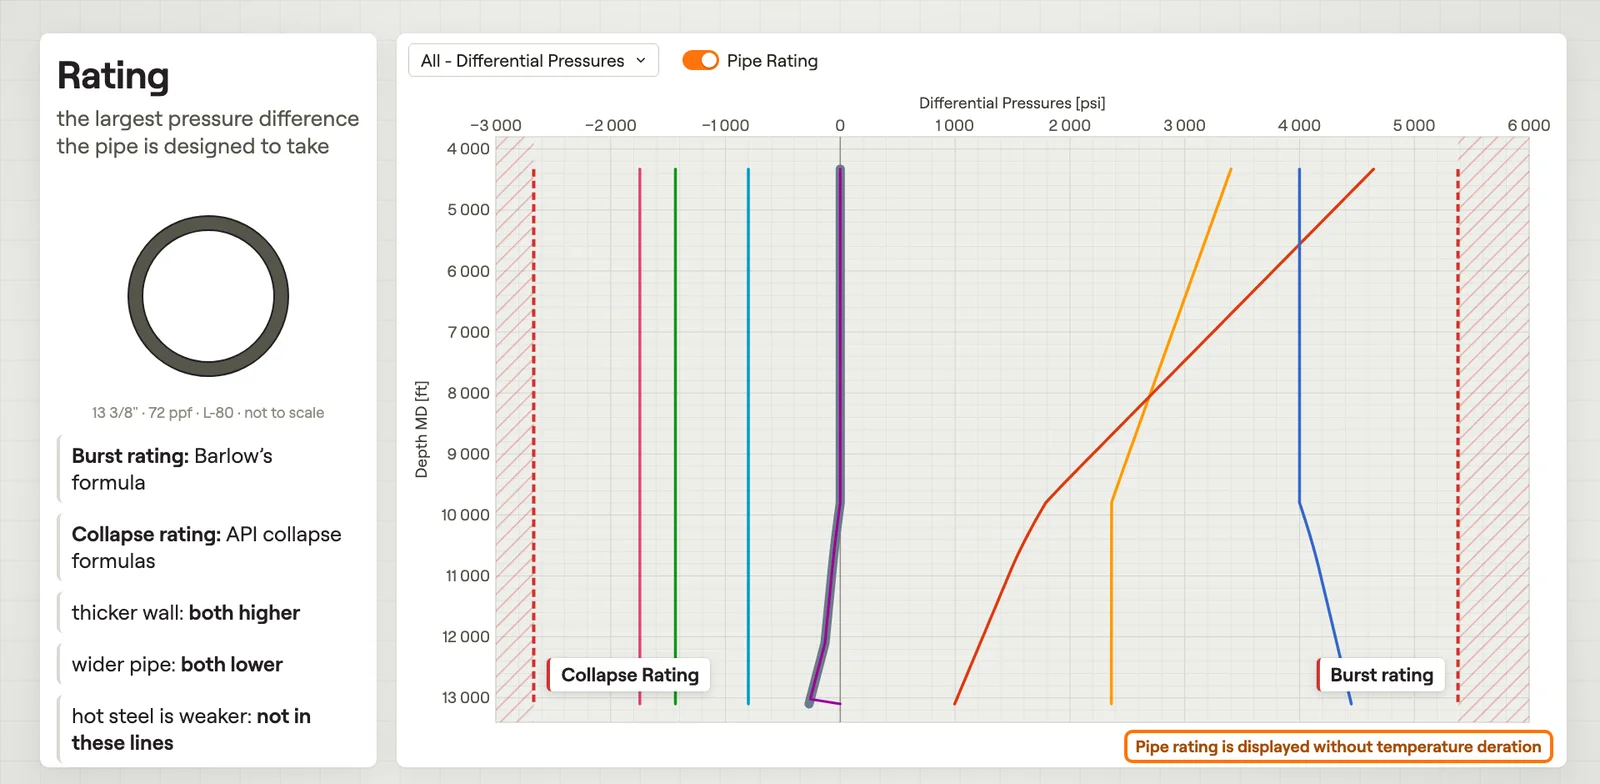 Differential PressuresPressure inside minus outside against depth, with the burst and collapse ratings.Film · 2:43
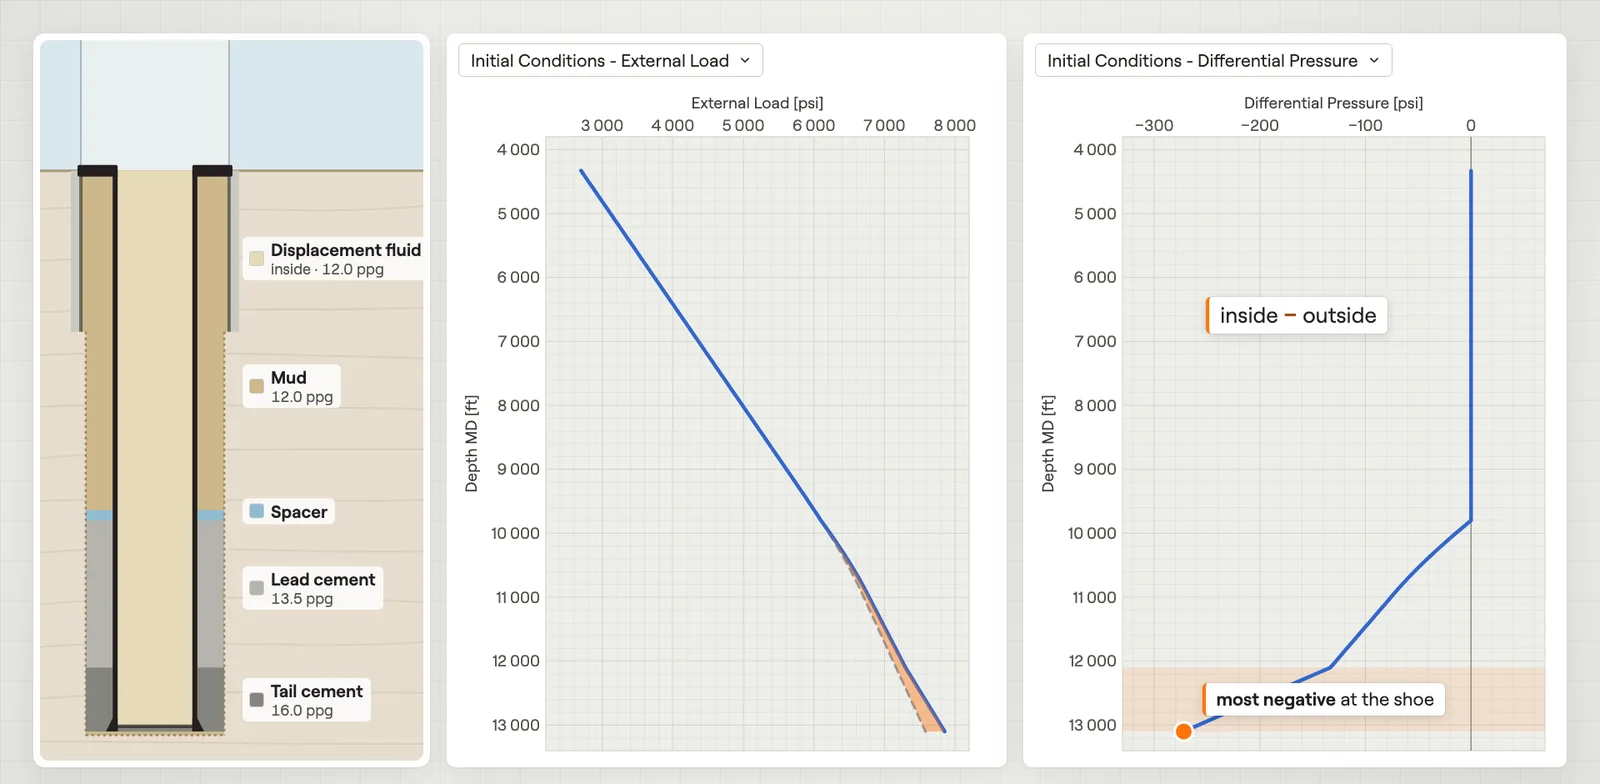 Initial ConditionsPressures, temperature and axial load of the string once it is installed.Film · 2:40
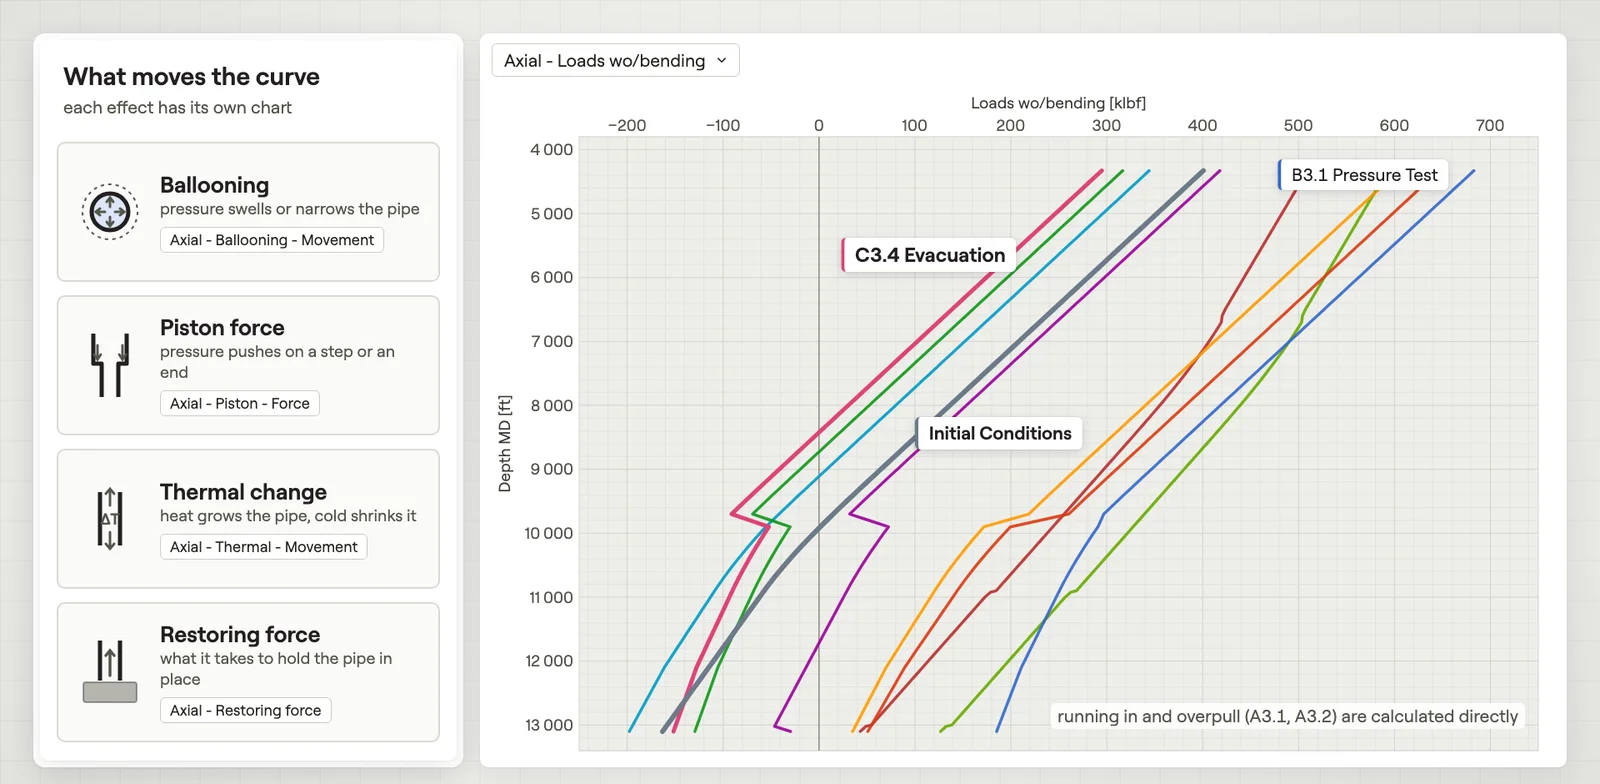 Axial LoadsThe true axial force in the steel against depth, with and without bending.Film · 2:56
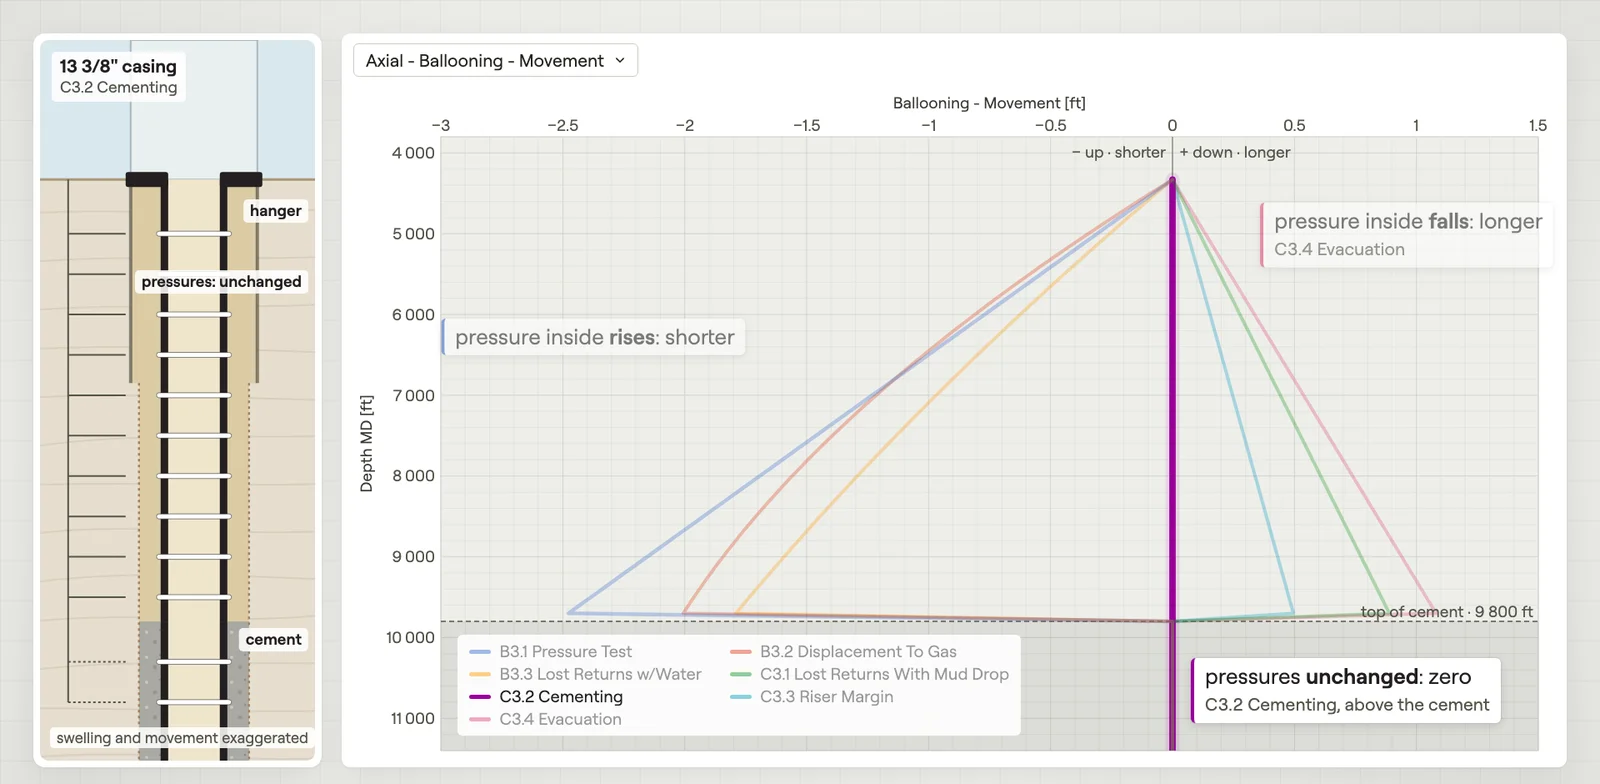 Ballooning – MovementHow much pressure changes lengthen or shorten the string.Film · 2:26
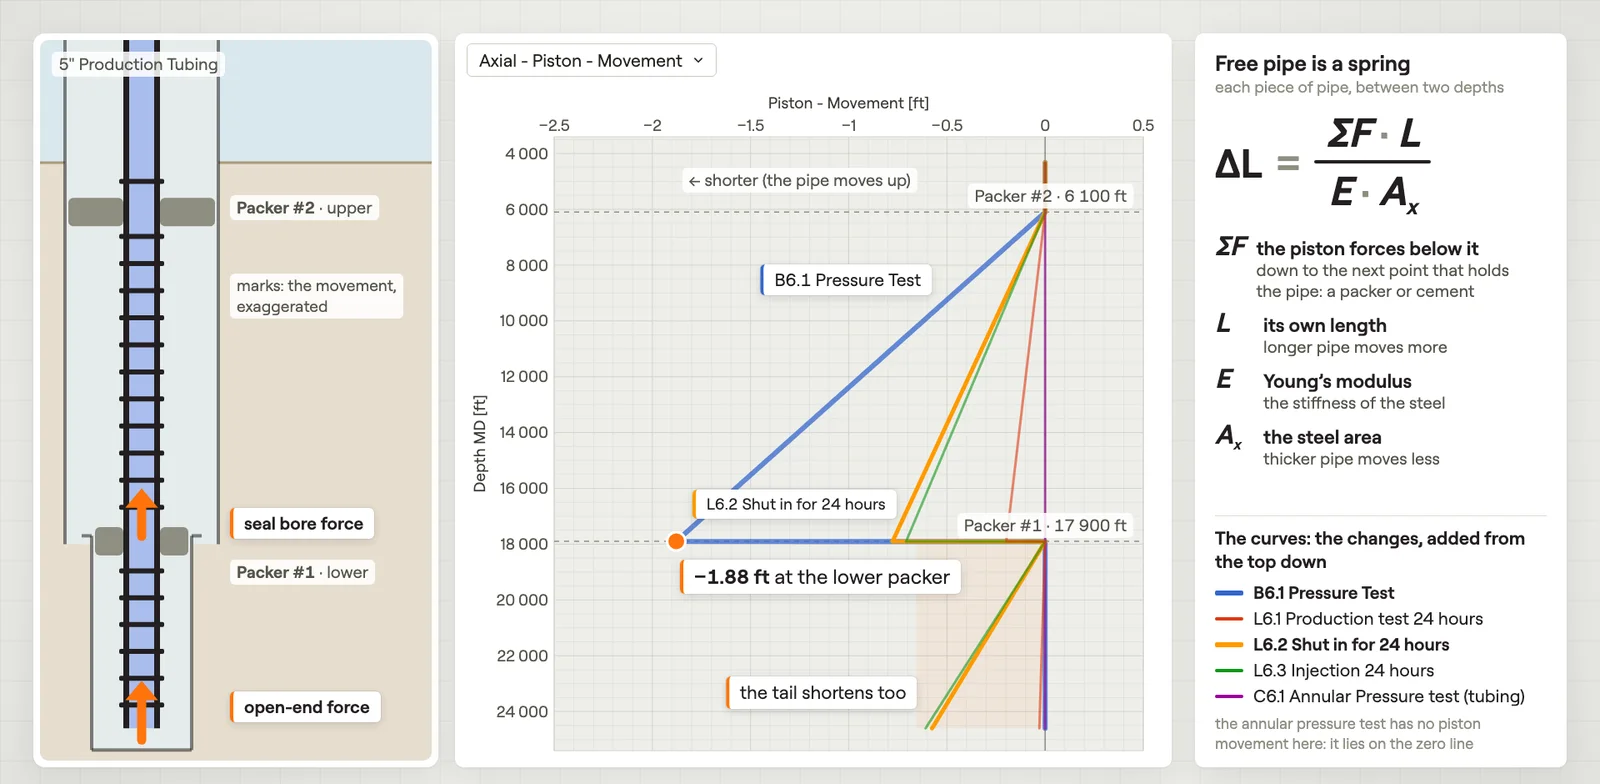 Piston – Movement & ForceHow much the piston forces move the string, and each piston force by depth.Film · 3:03
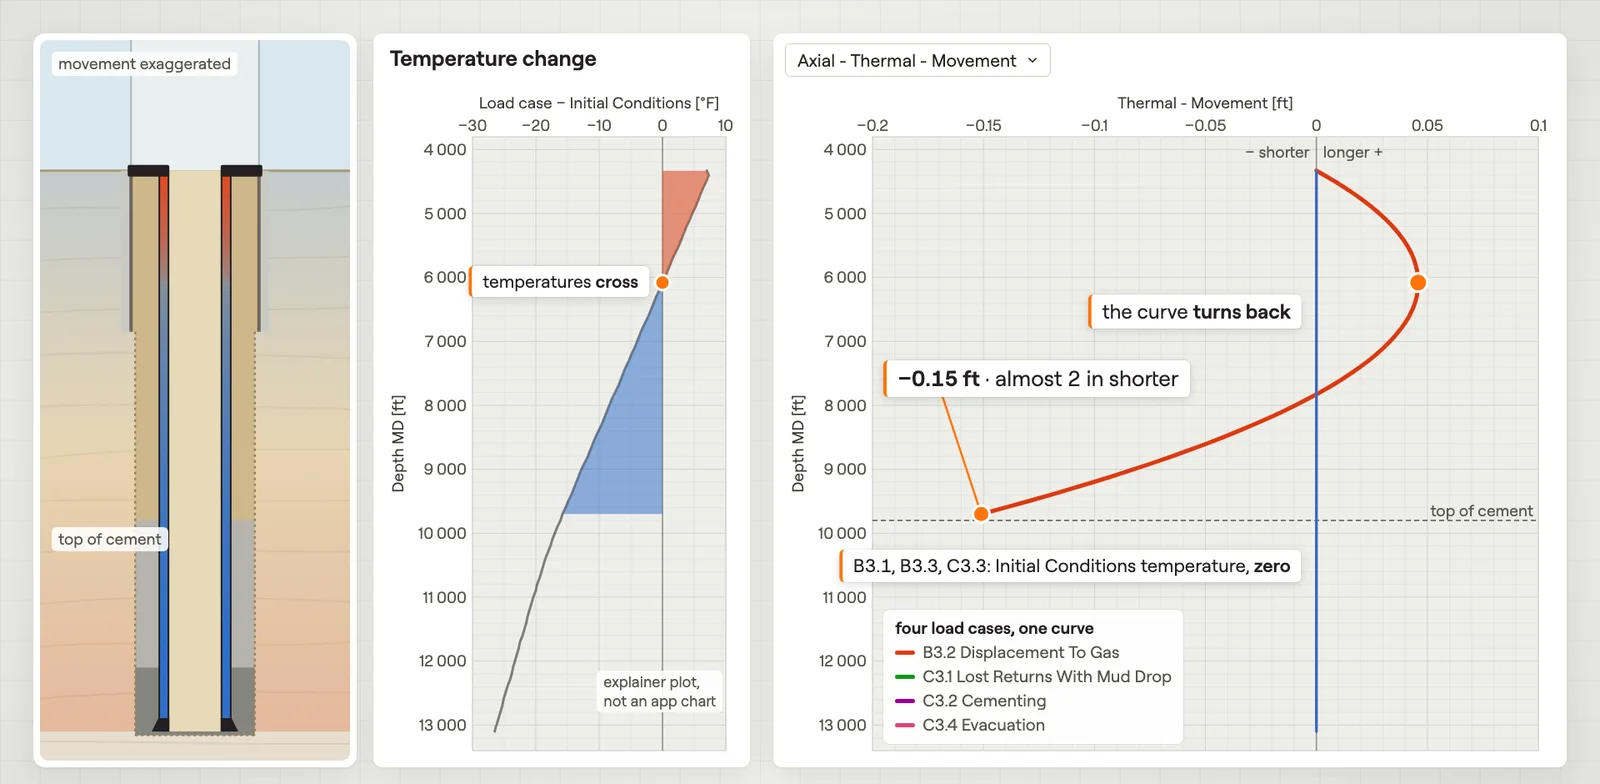 Thermal – MovementHow much temperature changes lengthen or shorten the string.Film · 2:31
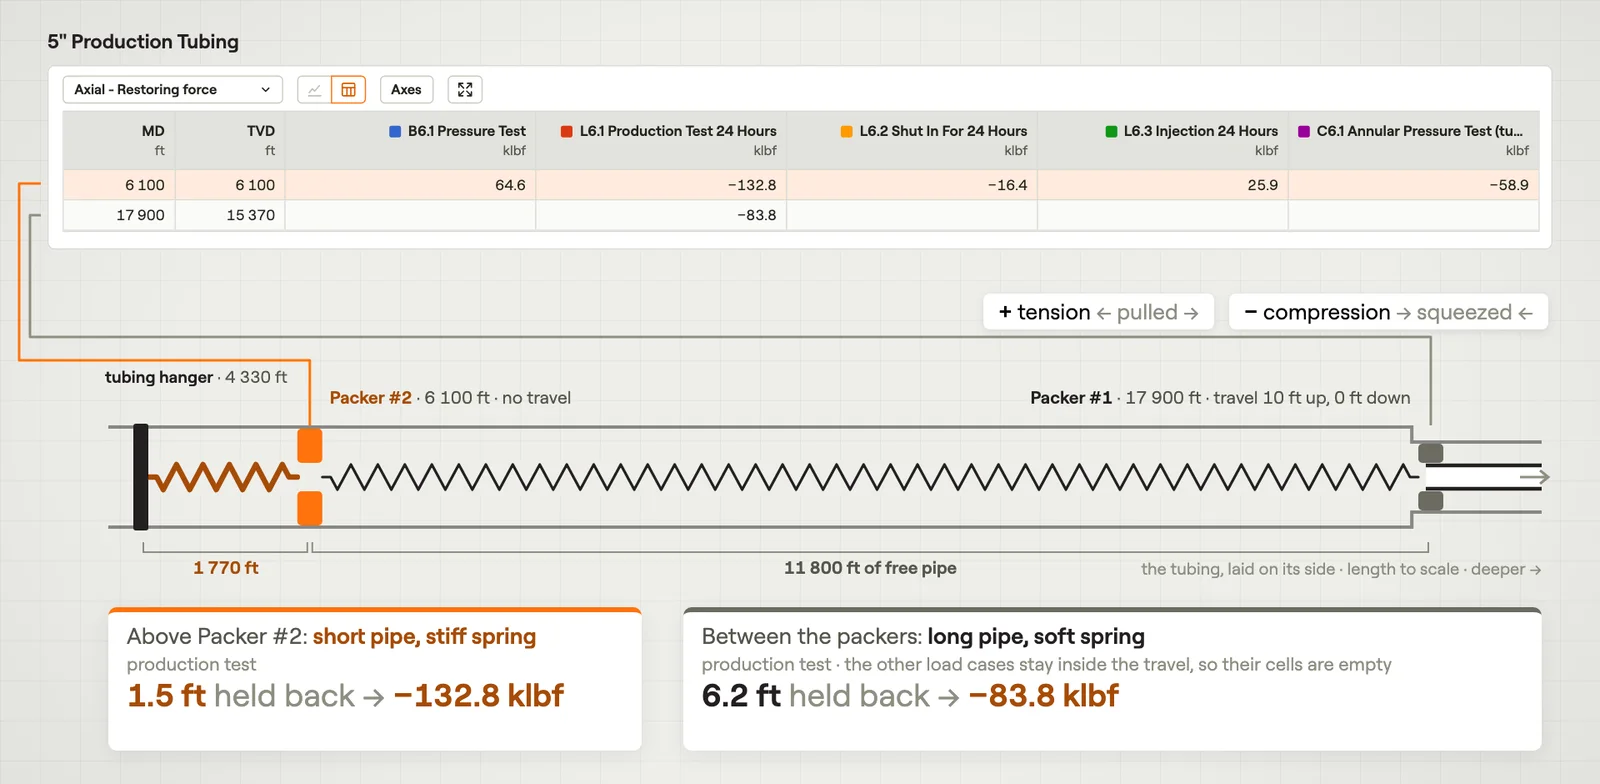 Restoring ForceThe force where cement or a packer stops the string from moving.Film · 2:44
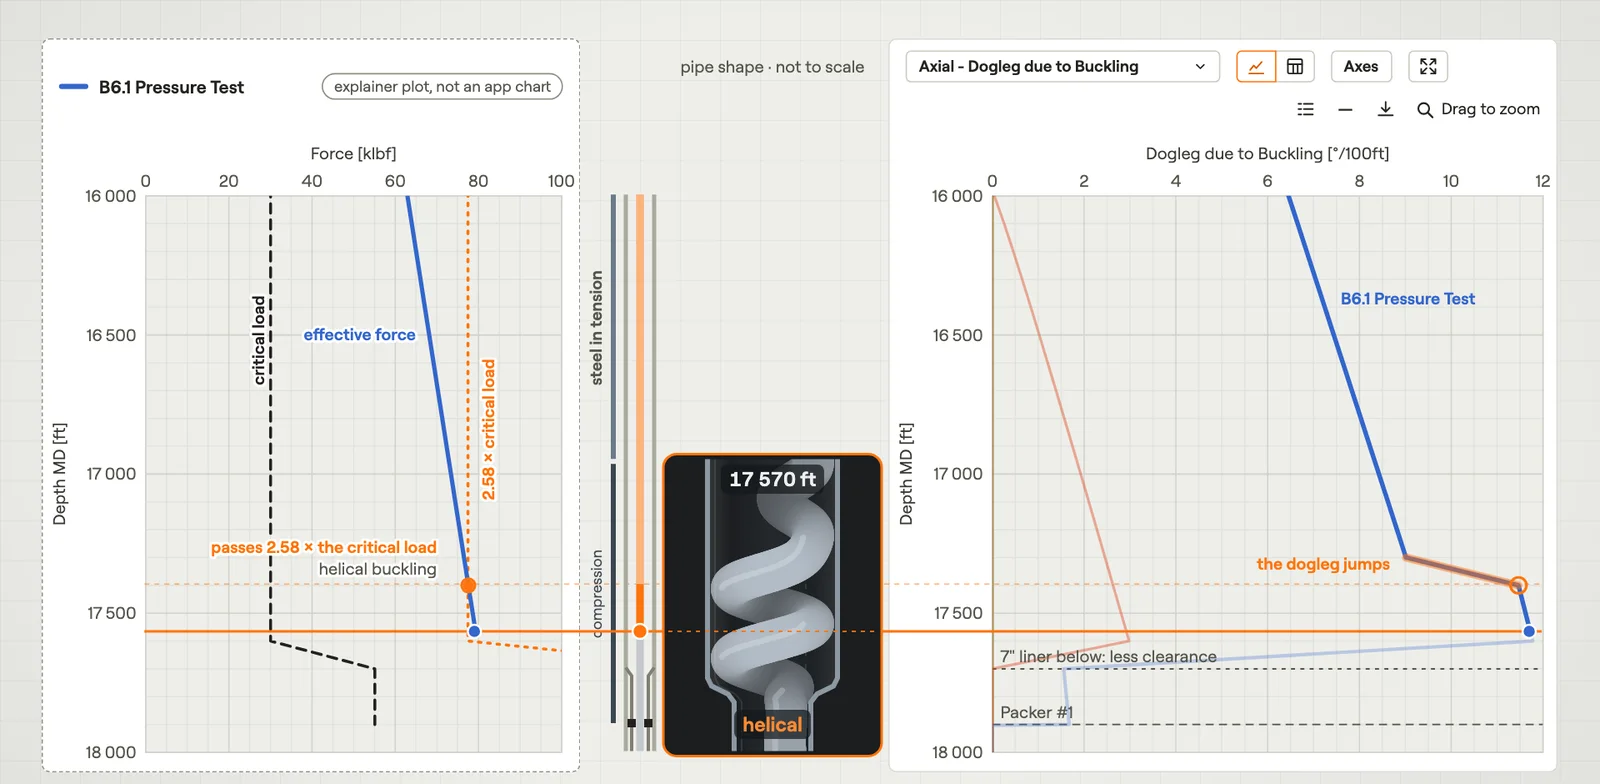 BucklingWhere the string buckles, how sharply it bends, and the bending force it adds.Film · 3:27
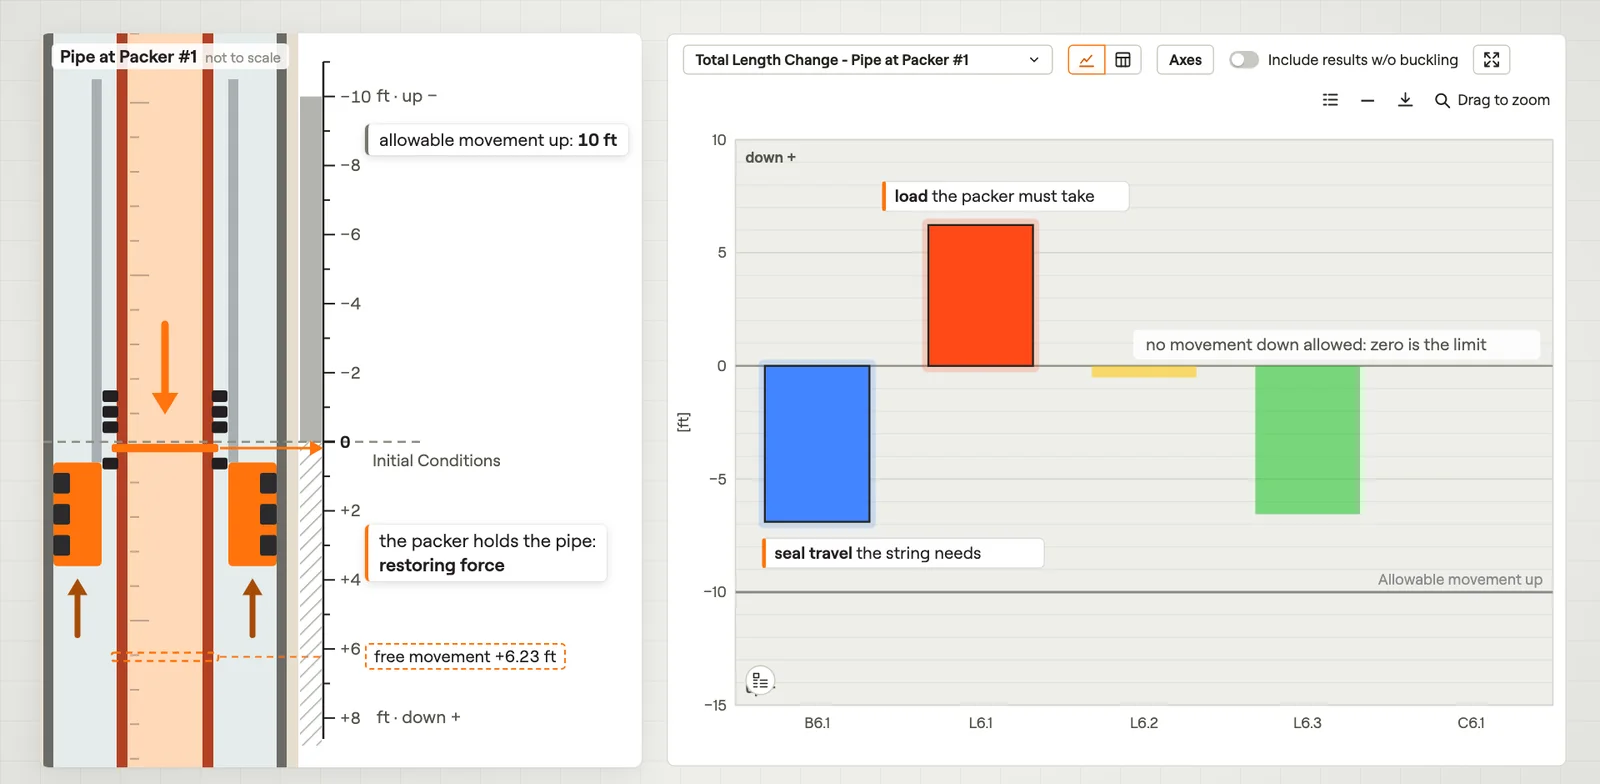 Total Length ChangeHow far one point of the string moves in each load case.Film · 2:47
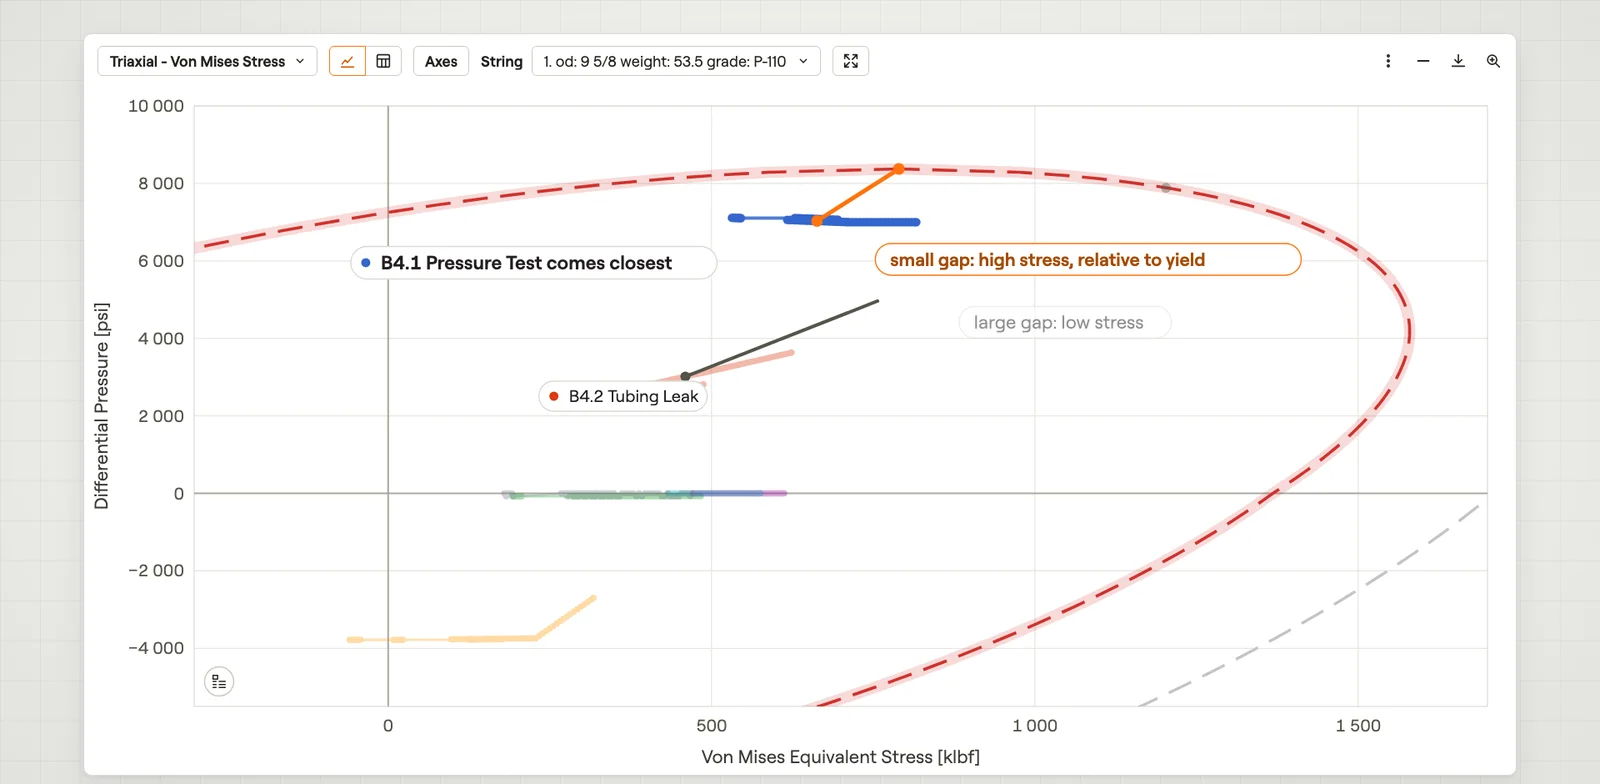 Von Mises StressHow close each load case comes to yield, at every depth of one string.Film · 2:56
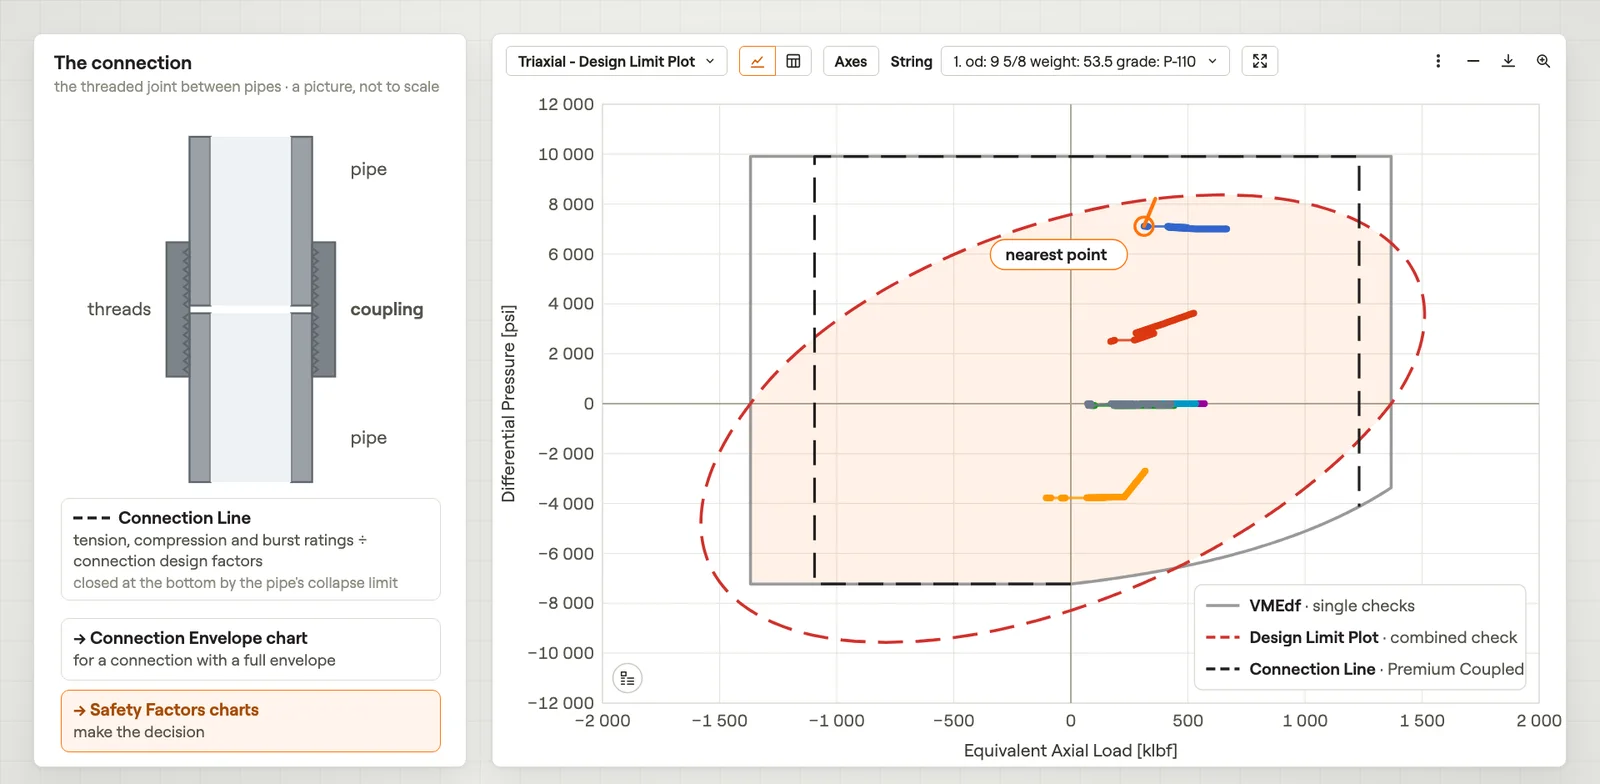 Design Limit PlotThe axial load and pressure of every load case and depth, against the pipe limits.Film · 2:49
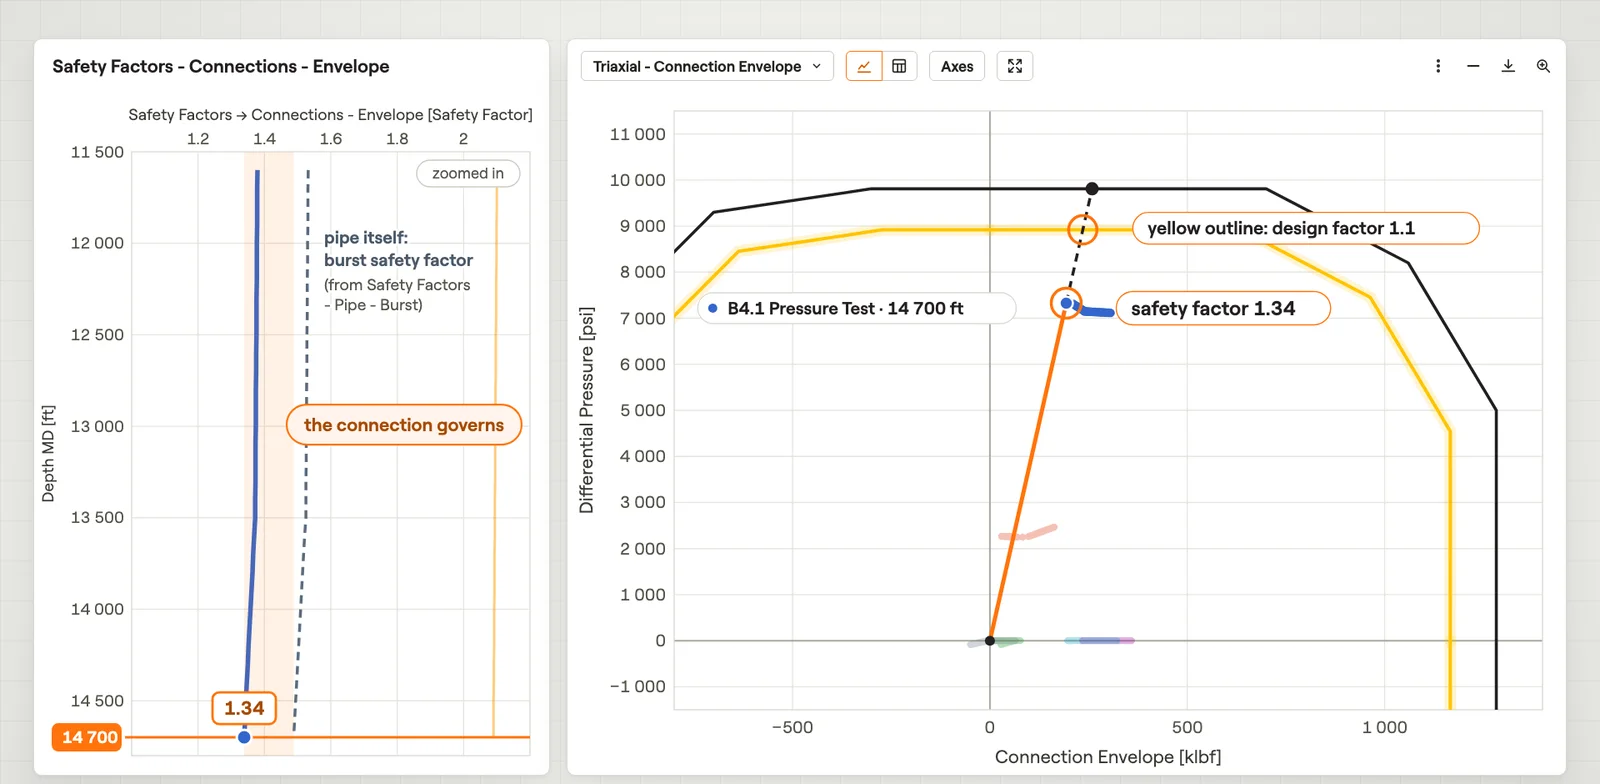 Connection EnvelopeThe axial load and pressure on a connection for every load case, against its envelope.Film · 3:10
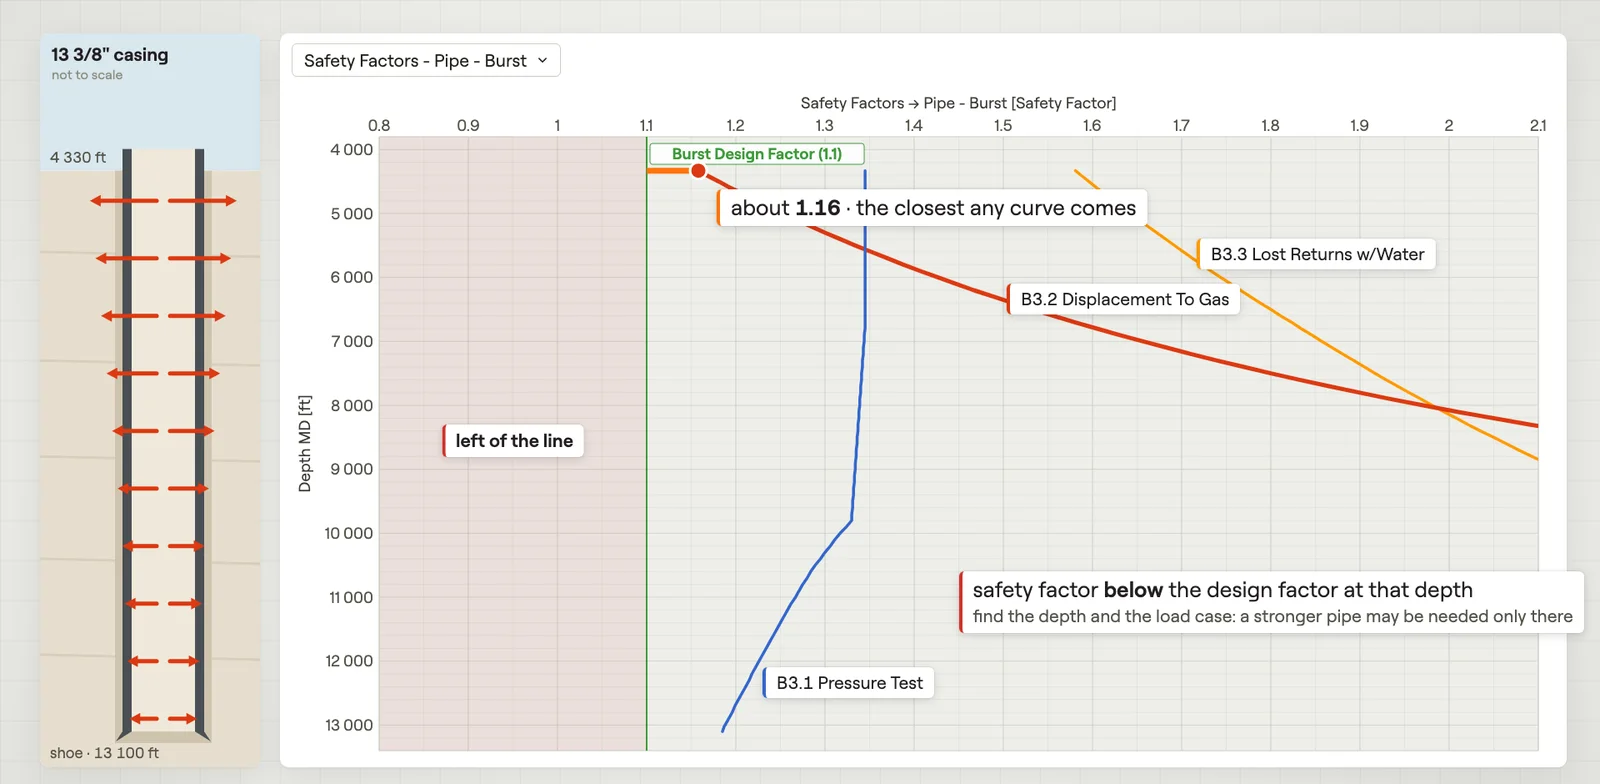 Safety FactorsThe safety factor of every load case against depth, one check at a time.Film · 2:19
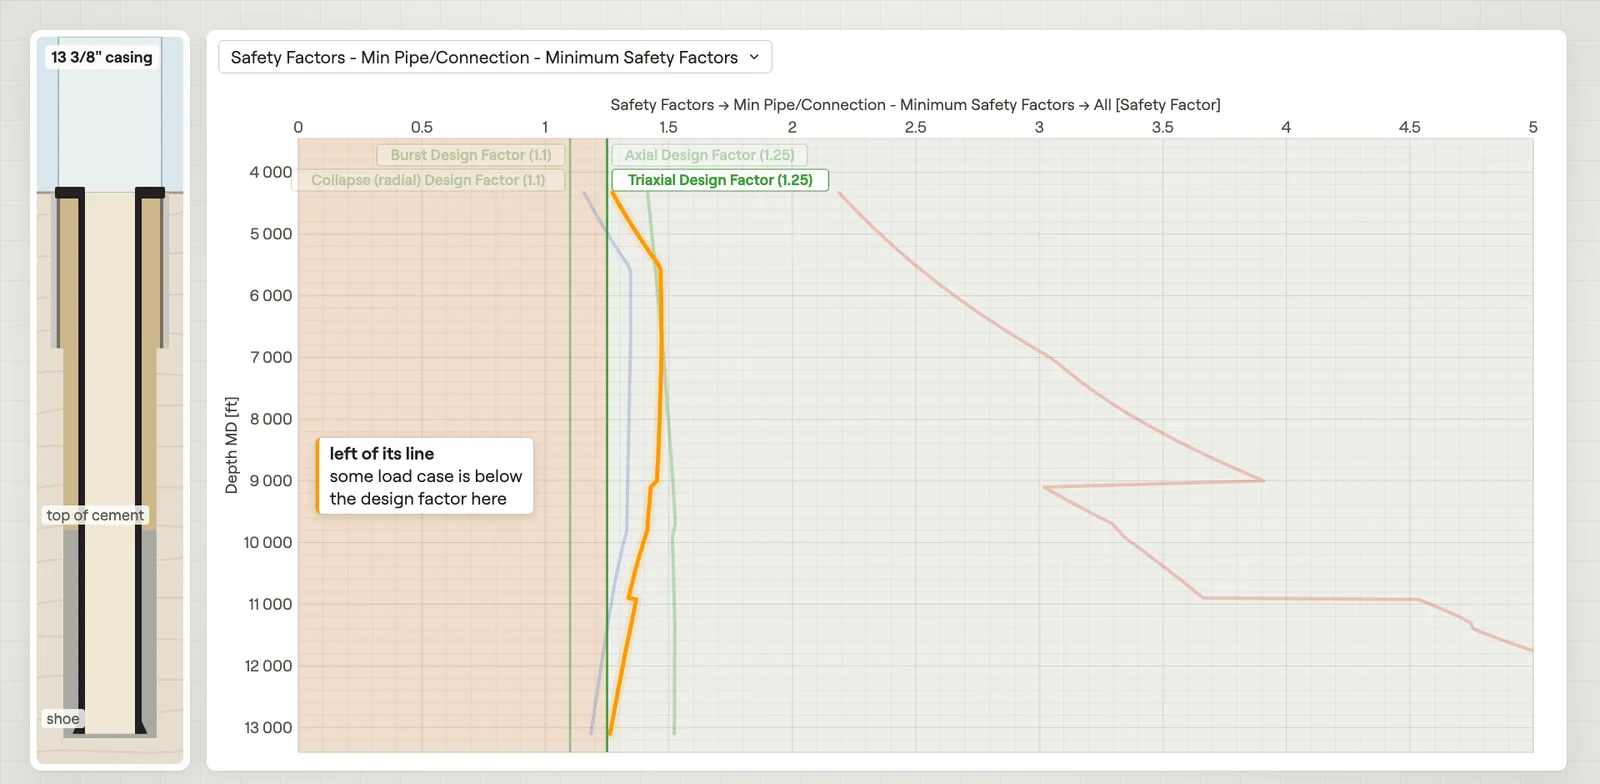 Minimum Safety FactorsThe lowest safety factor over all load cases at every depth, one curve per check.Film · 2:37
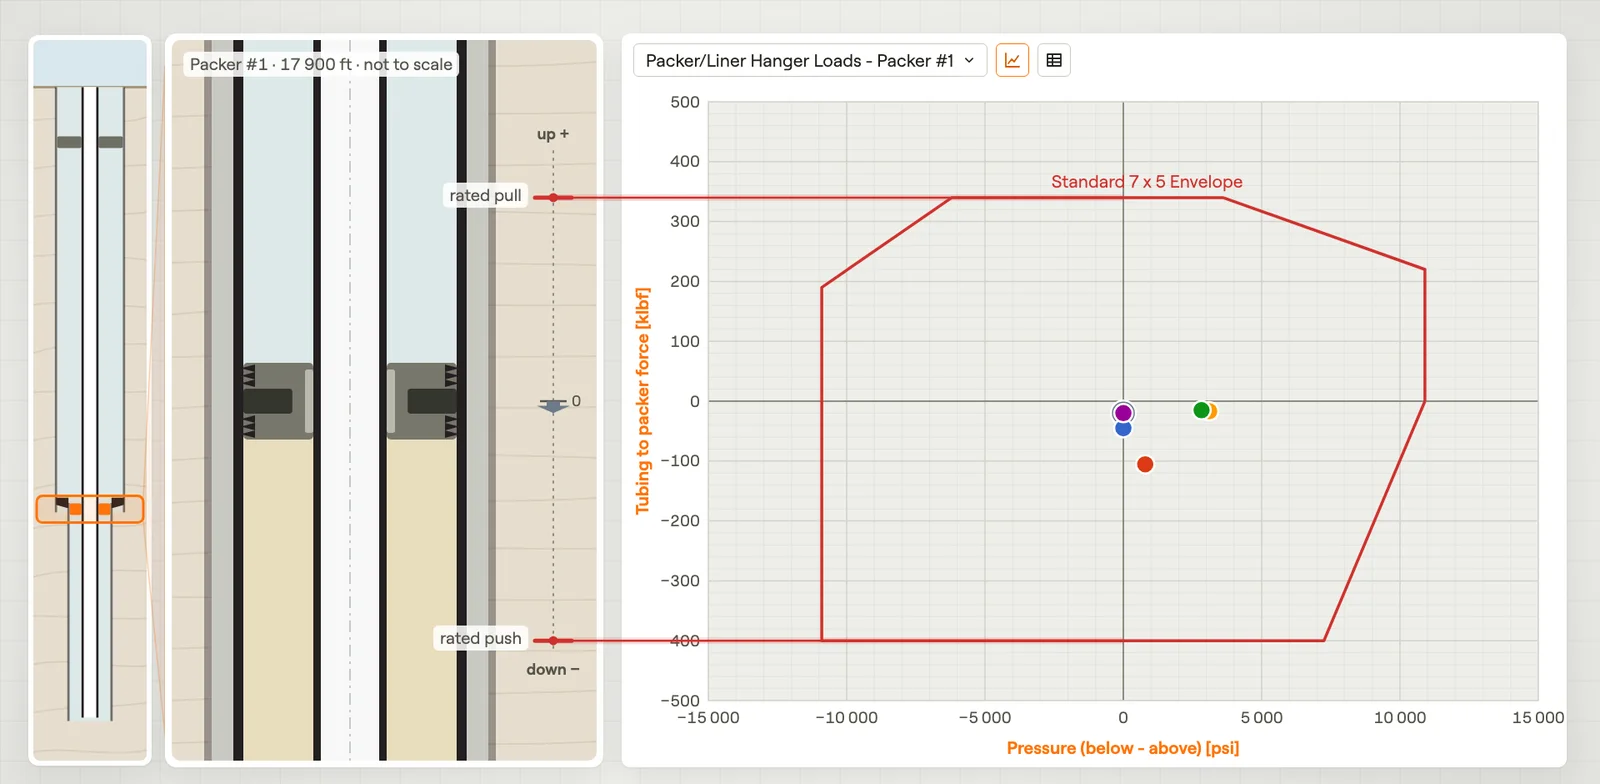 Packer & Liner Hanger LoadsThe force and pressure difference on a packer or liner hanger, against its envelope.Film · 3:11
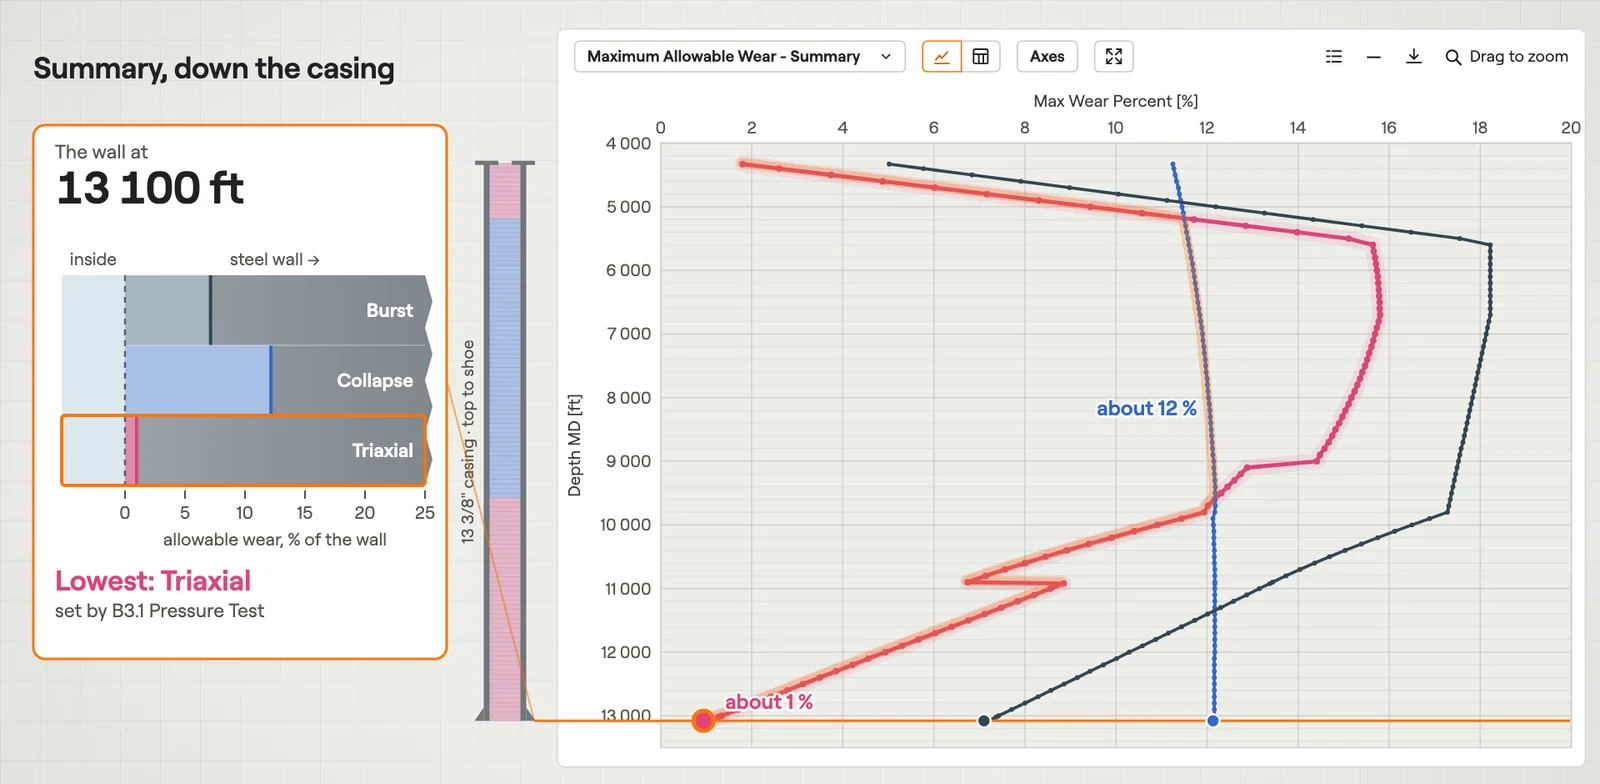 Maximum Allowable WearHow much wall the casing can lose before a safety factor reaches its design factor.Film · 2:54
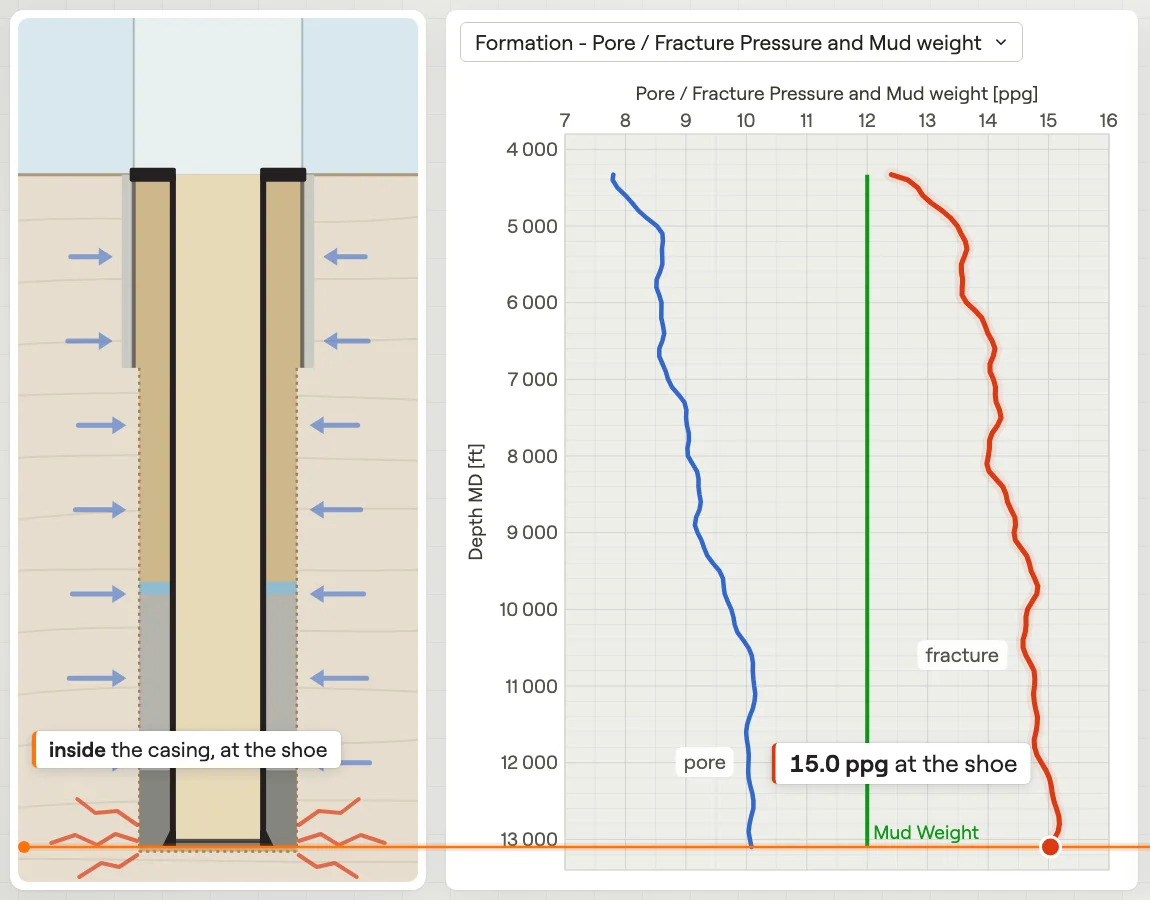 Temperature, Formation & TrajectoryThe temperature, formation pressures and well path behind the loads.Film · 2:06