Blowout & Kill charts
Every main chart and table in the Blowout Simulation and the Kill Simulation has its own page here. Each page says what the chart shows, what it is used for and how to read it, with an example chart and a short explanation film.
Two simulations
The charts belong to two simulations. The blowout simulation comes first, and the kill simulation starts from its result.
| Simulation | What it calculates | How its charts are plotted |
|---|---|---|
| Blowout | The pressure and the flow rates of oil, gas and water when the well flows freely to the release point. | One row or curve per flow path. Depth charts use measured depth. |
| Kill | The pressures, rates and volumes while kill mud is pumped through a relief well into the blowout well. | Against time in seconds, or against true vertical depth at one chosen time. |
A flow path is the route the fluid takes up the well: inside the drill pipe, in the annulus outside it, or in the open hole with no pipe in the well. The release point is where the flow leaves the well, at the seabed or at the surface.
The example
All pages use one example well, in US field units. It is an offshore well in 1,150 ft of water with a 9 5/8 in casing shoe at 18,045 ft measured depth and 8 1/2 in open hole to 24,606 ft. The reservoir pressure is 6,872 psi and the release point is the seabed.
The example has one blowout simulation, one environment risk simulation and two kill simulations for the open hole flow path:
- Kill, first design ends with the result "Fractured @ shoe".
- Kill, second design ends with the result "Killed".
The numbers on each page are calculated results for this well, and the film on the page shows the same numbers.
Blowout Simulation
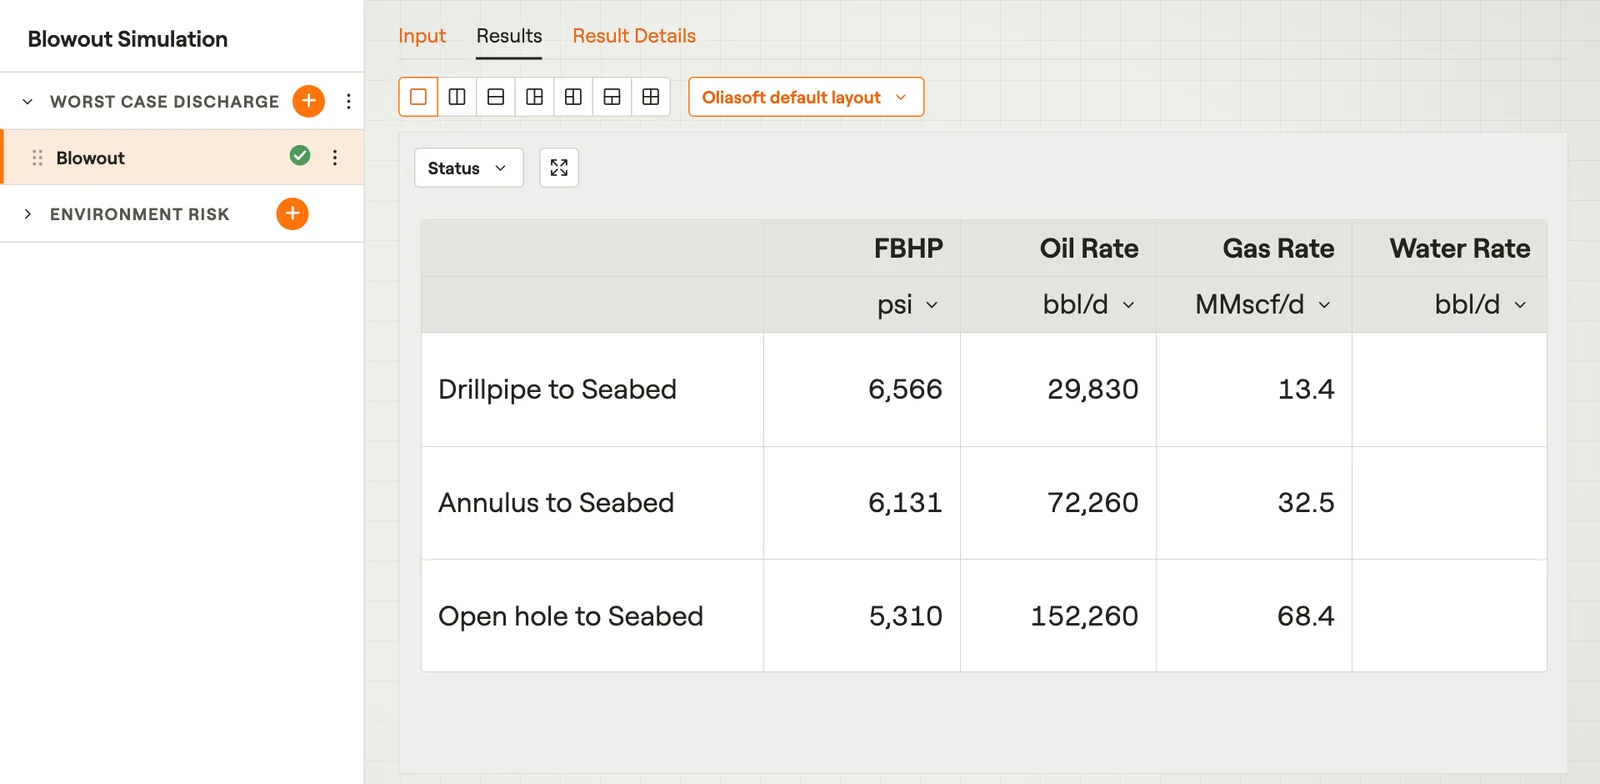 Blowout StatusThe pressure at the reservoir and the oil, gas and water rates for each flow path.Film · 3:03
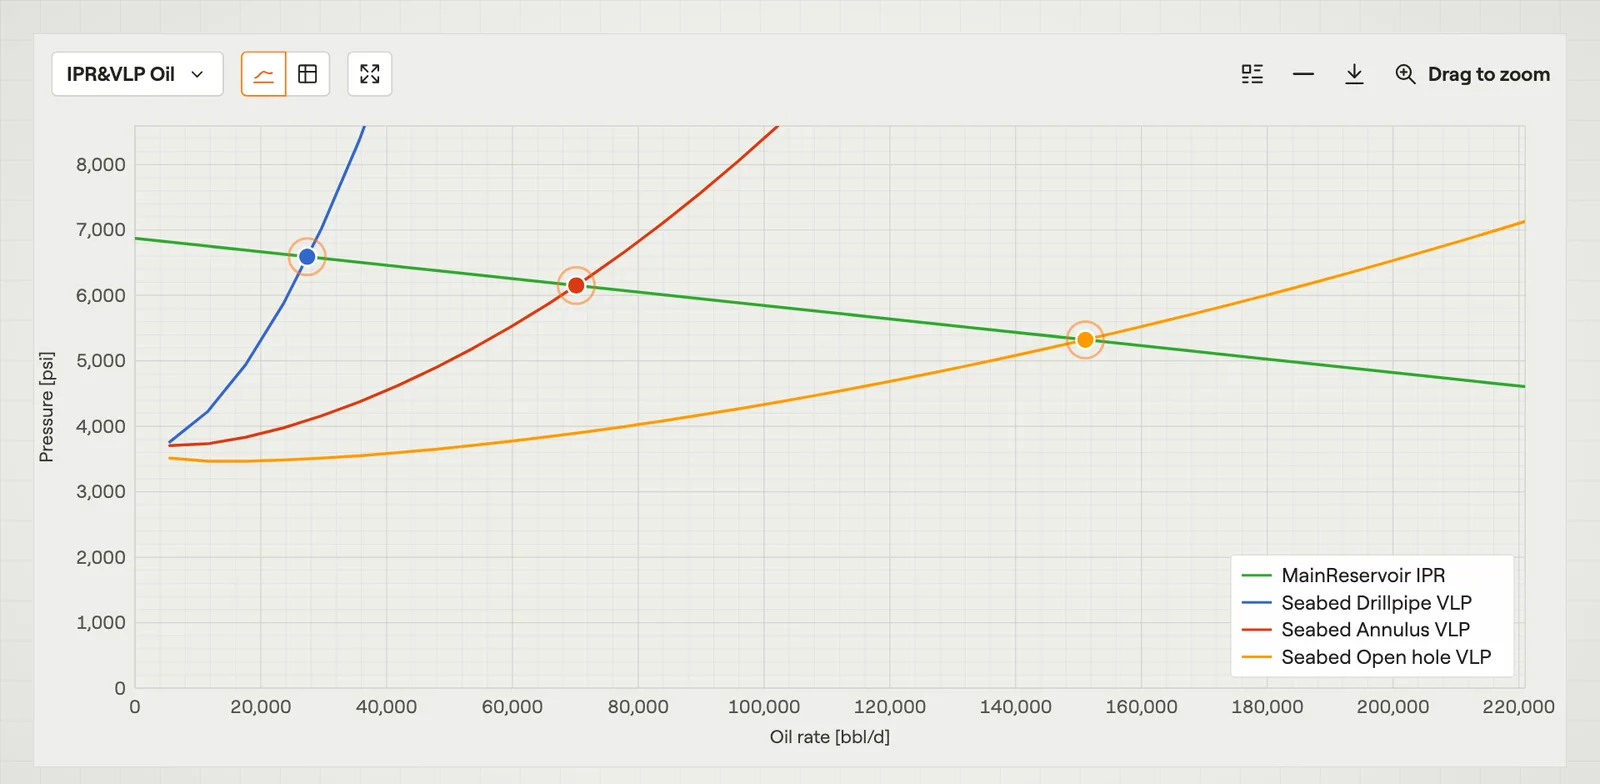 IPR & VLPOne curve for the reservoir and one curve for each flow path, against the oil rate.Film · 3:01
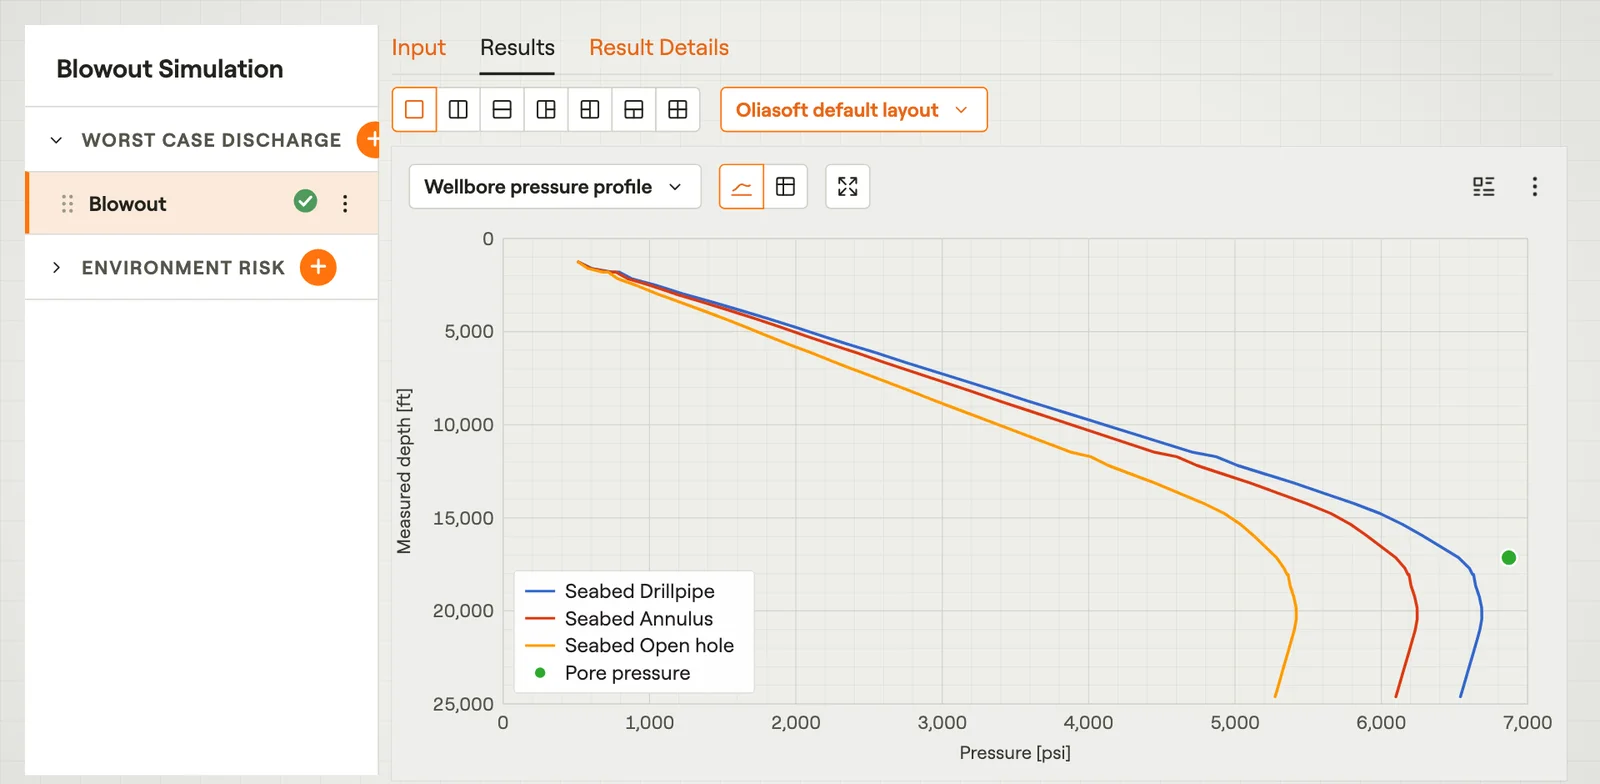 Wellbore Pressure ProfileThe pressure along the well during a blowout, with one curve for each flow path.Film · 2:39
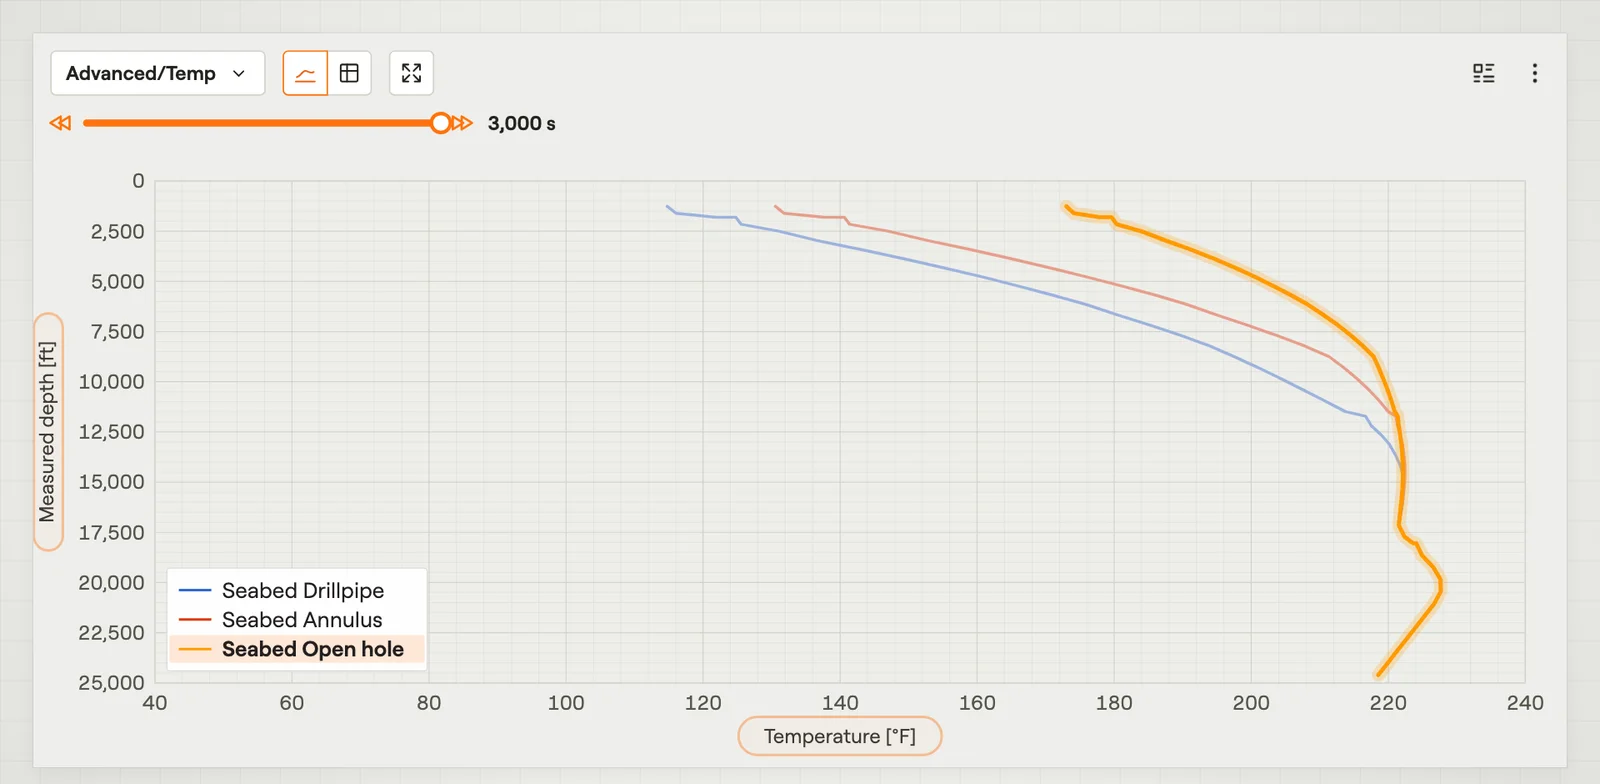 Temperature & Advanced ProfilesOne calculated quantity along the well, with one curve for each flow path.Film · 2:58
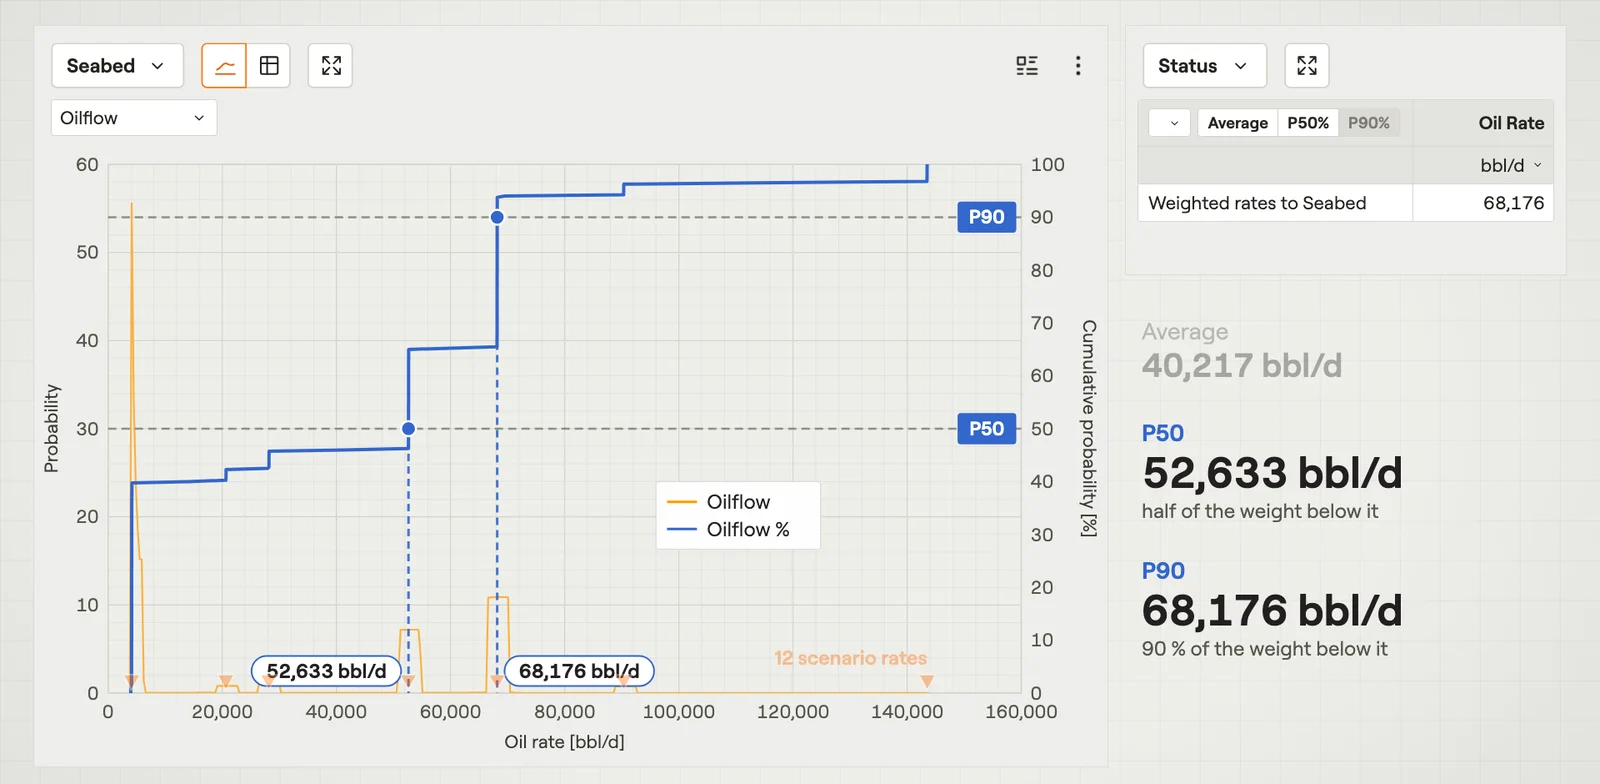 Weighted RatesWeighted blowout rates of an environment risk simulation, and the rate against probability.Film · 3:20
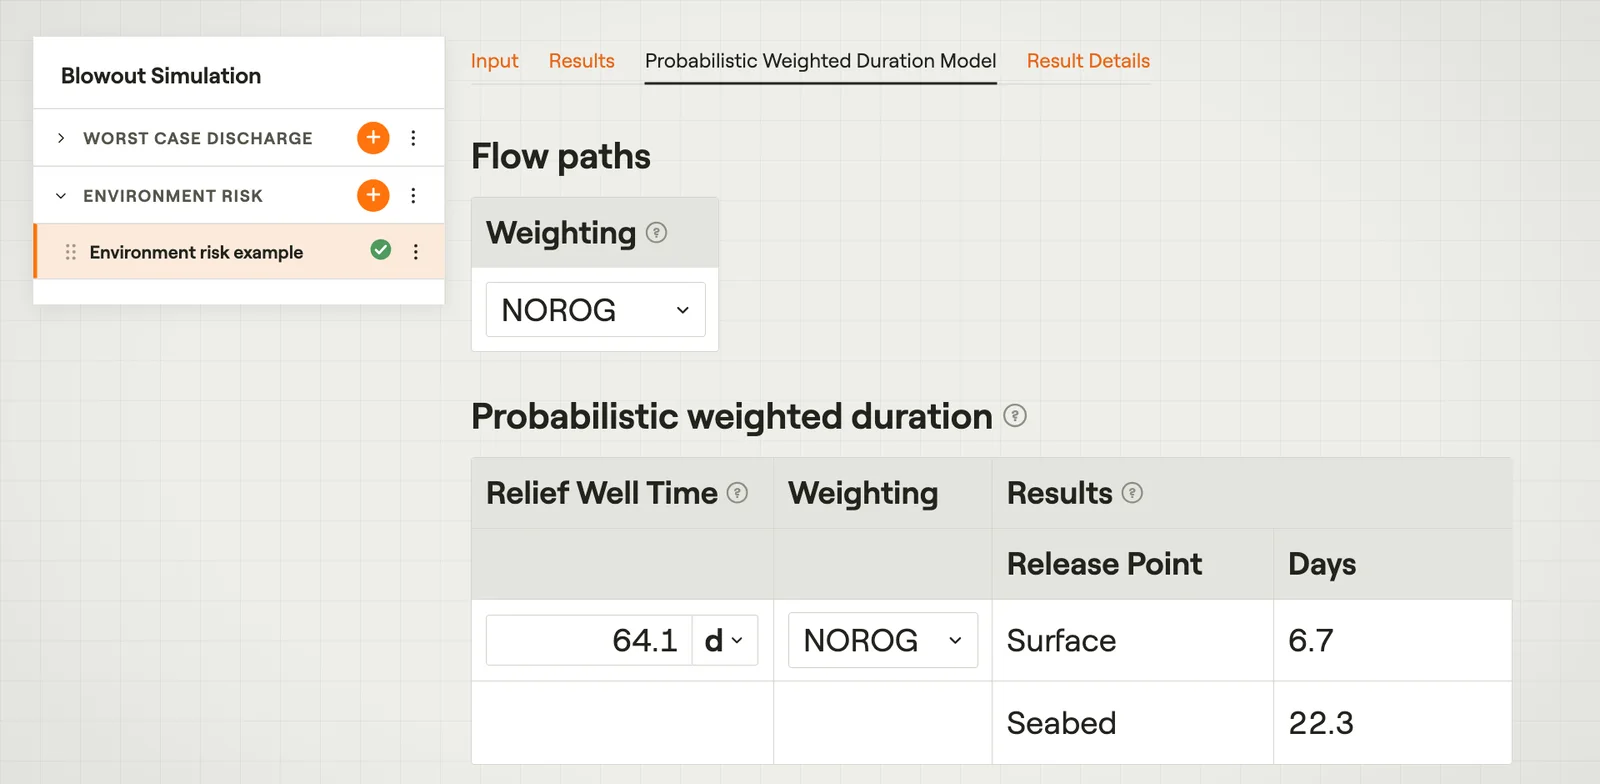 Blowout Duration & Environment RiskHow long a blowout is expected to last, in days, from the relief well time.Film · 3:05
Kill Simulation
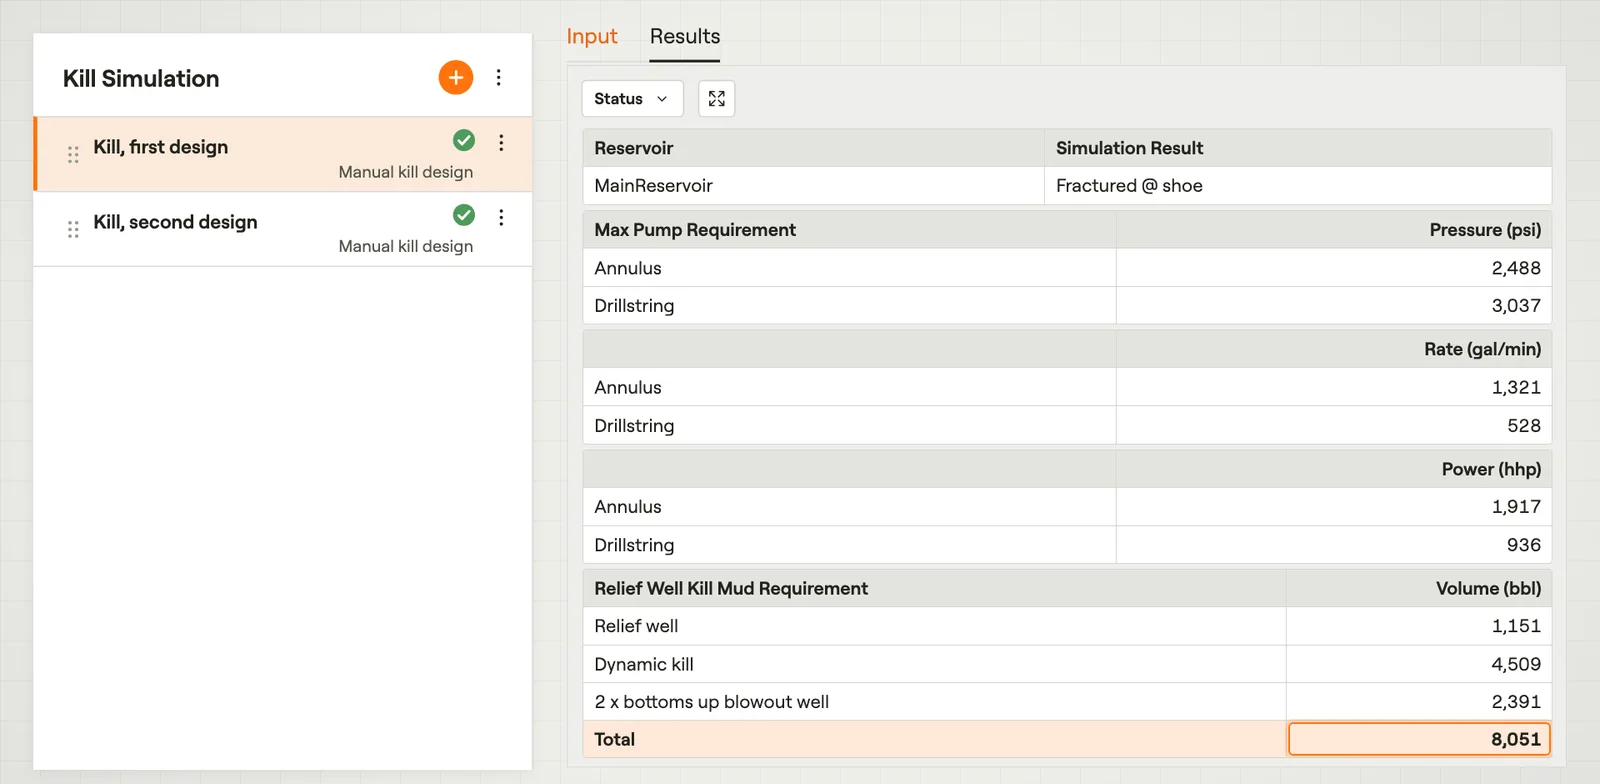 Kill StatusThe result of a kill simulation, the largest pump values and the kill mud needed.Film · 3:17
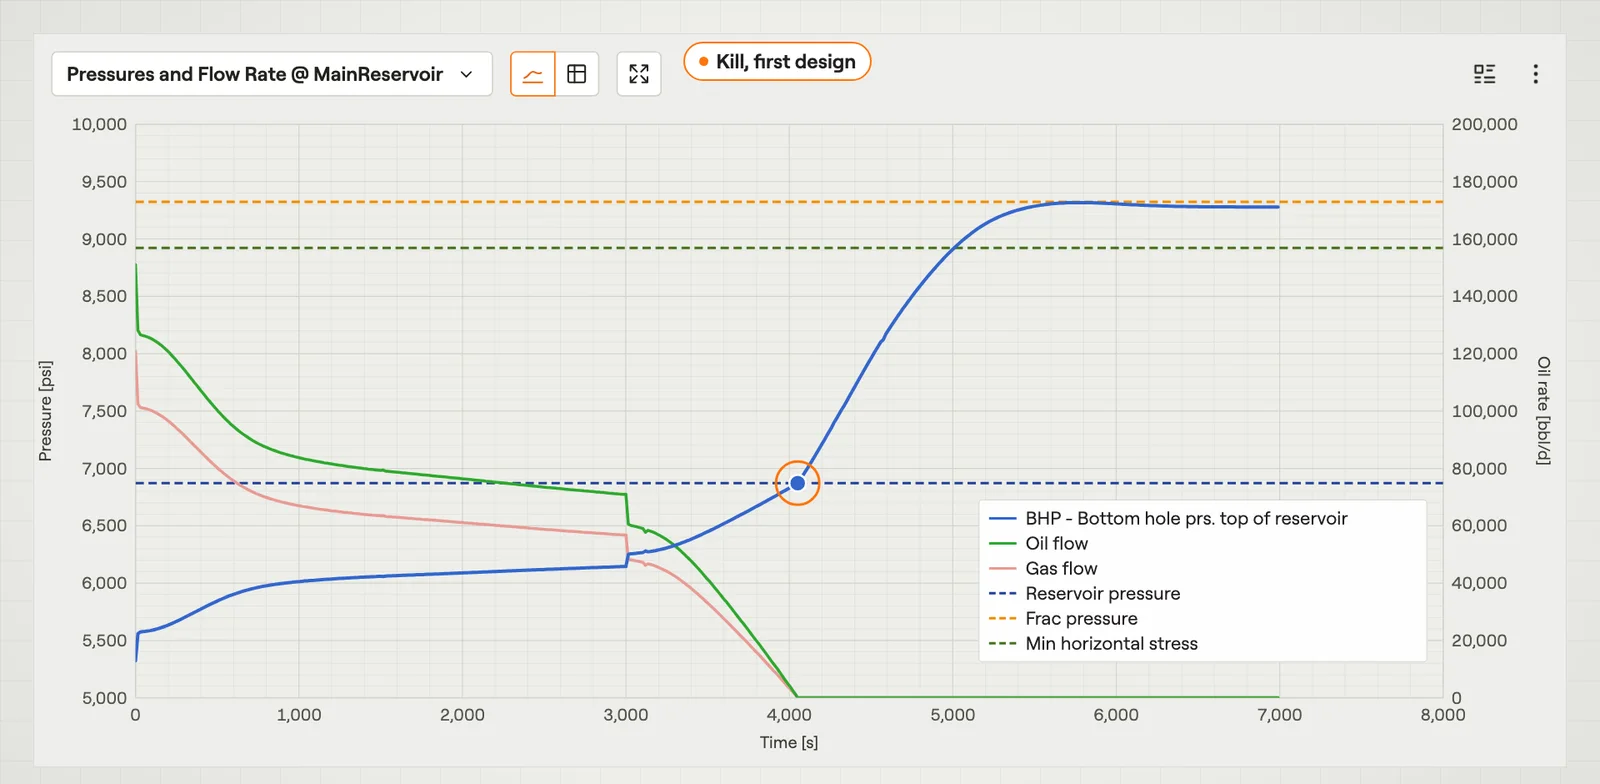 Pressures and Flow Rate at the ReservoirThe pressure in the blowout well at the reservoir during a kill, and the inflow.Film · 3:12
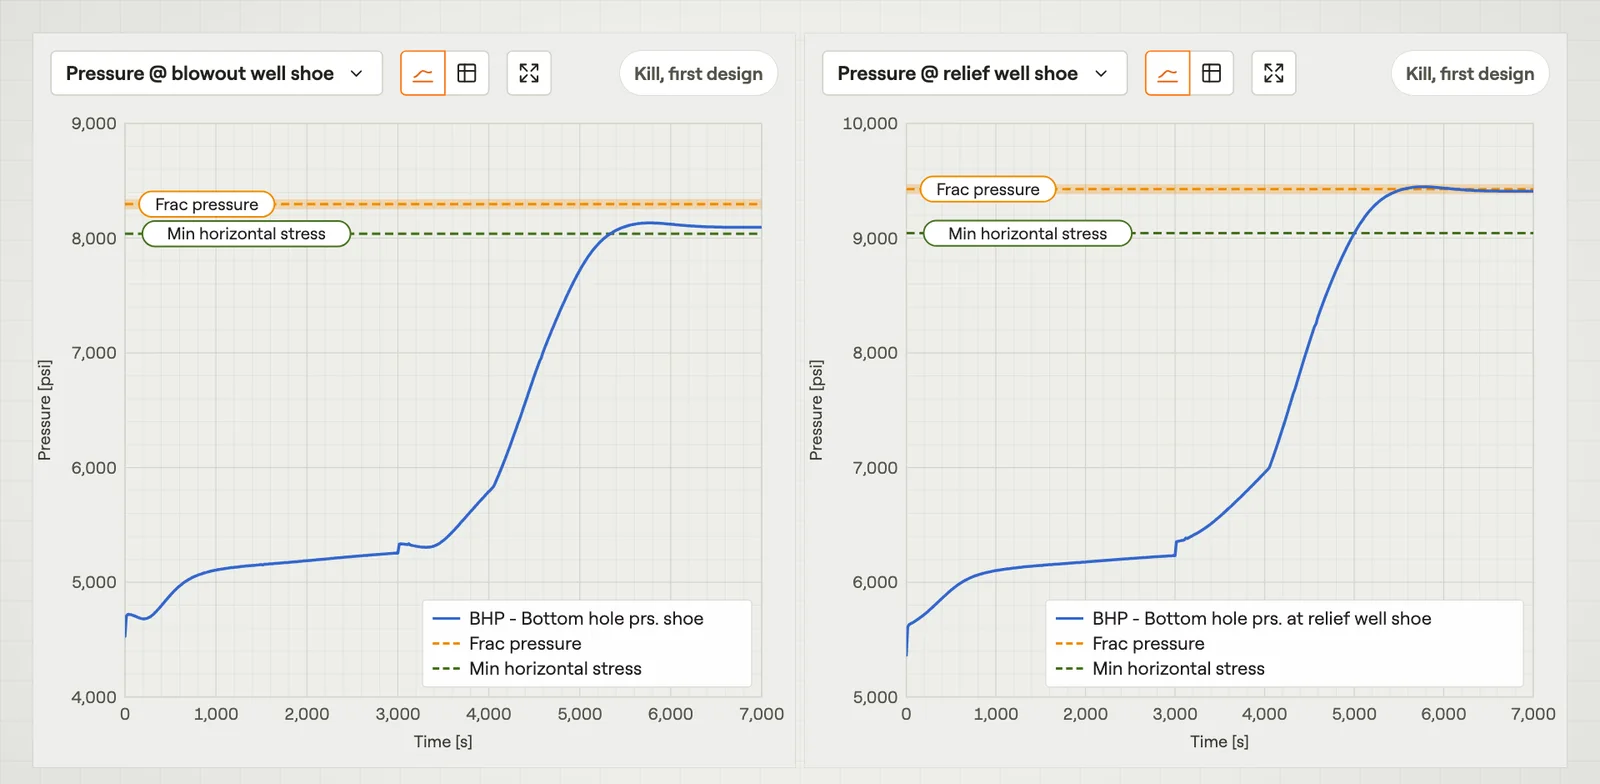 Pressure at the ShoeThe pressure at the blowout well casing shoe and at the relief well shoe during a kill.Film · 3:07
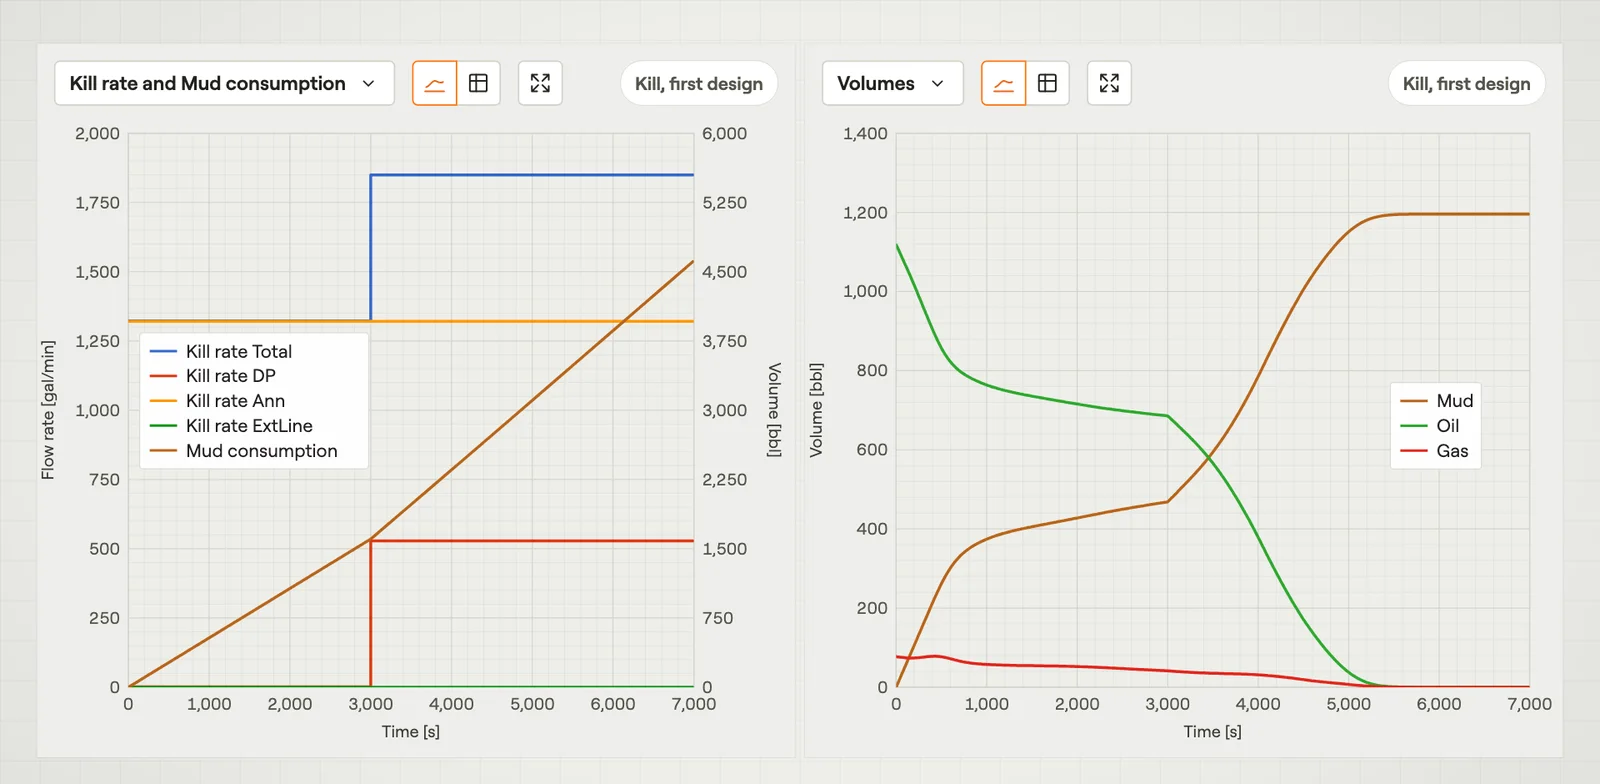 Kill Rate, Mud Consumption & VolumesHow fast kill mud is pumped, how much is used, and what is inside the well.Film · 3:04
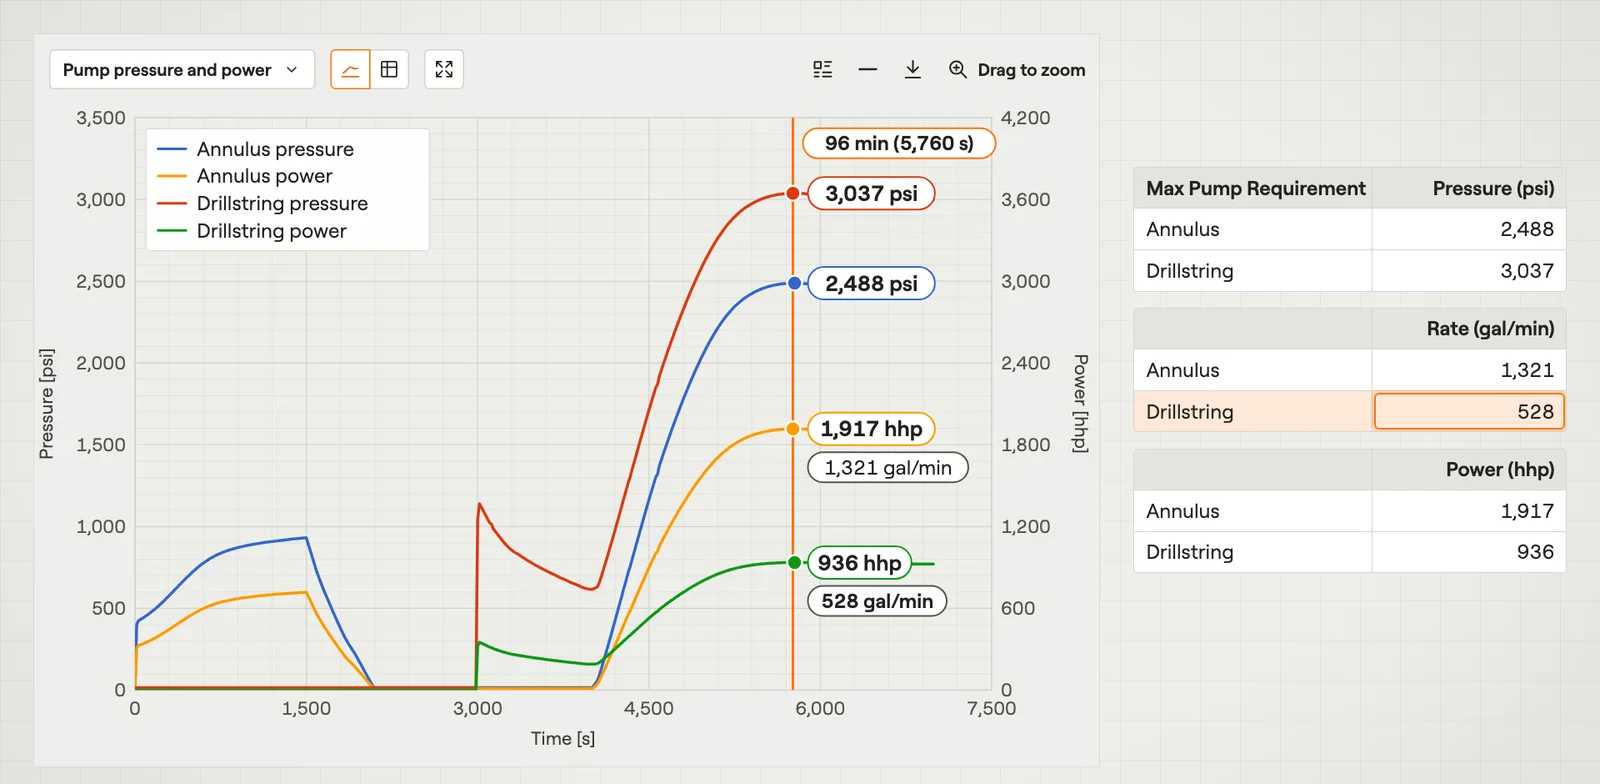 Pump Pressure and PowerThe pressure and the power that the pumps must deliver during a kill.Film · 3:17
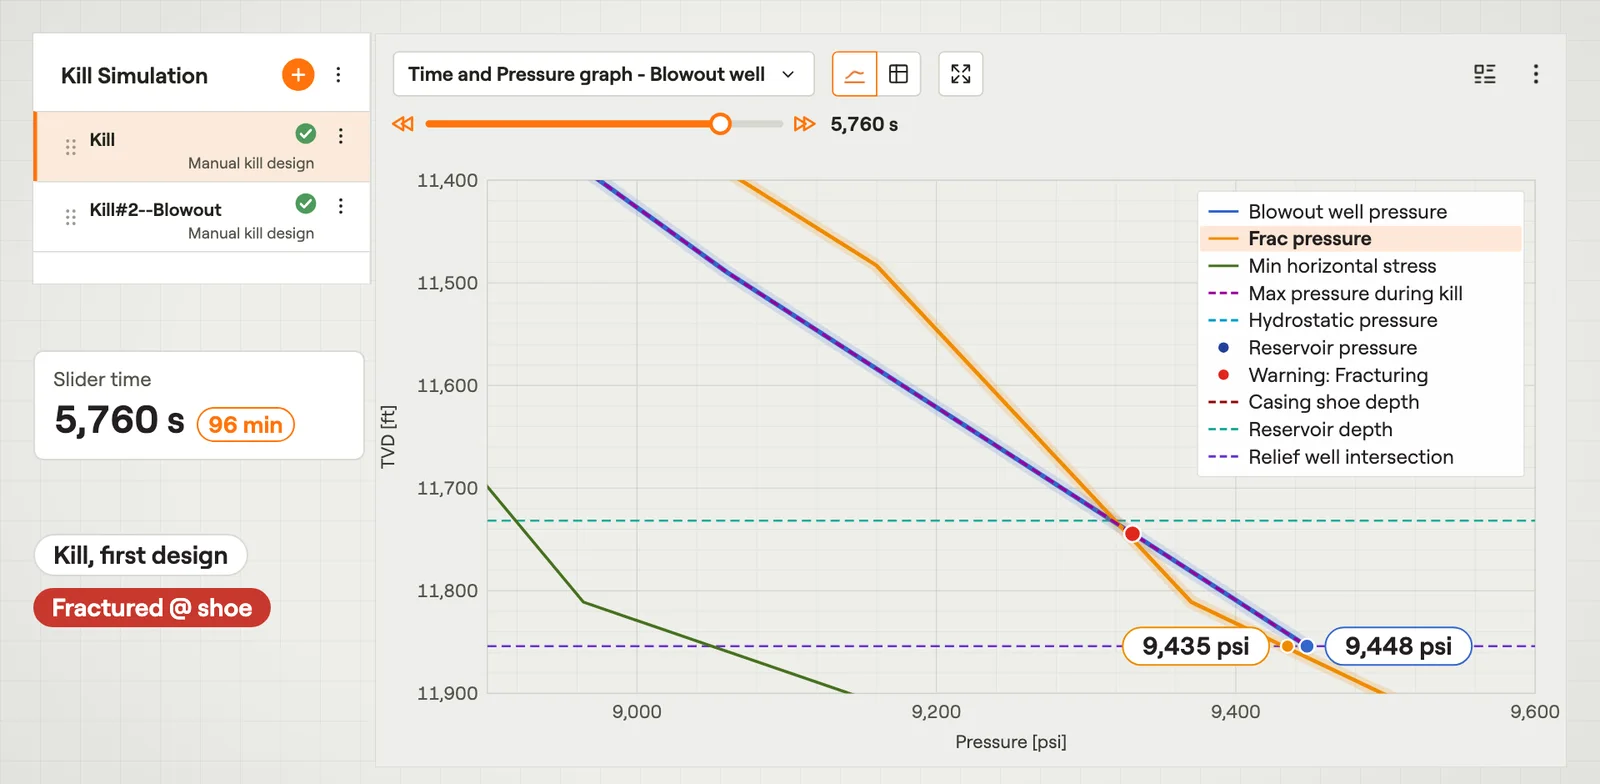 Time and Pressure GraphThe pressure along a well at one moment of the kill, against the fracture pressure.Film · 3:11
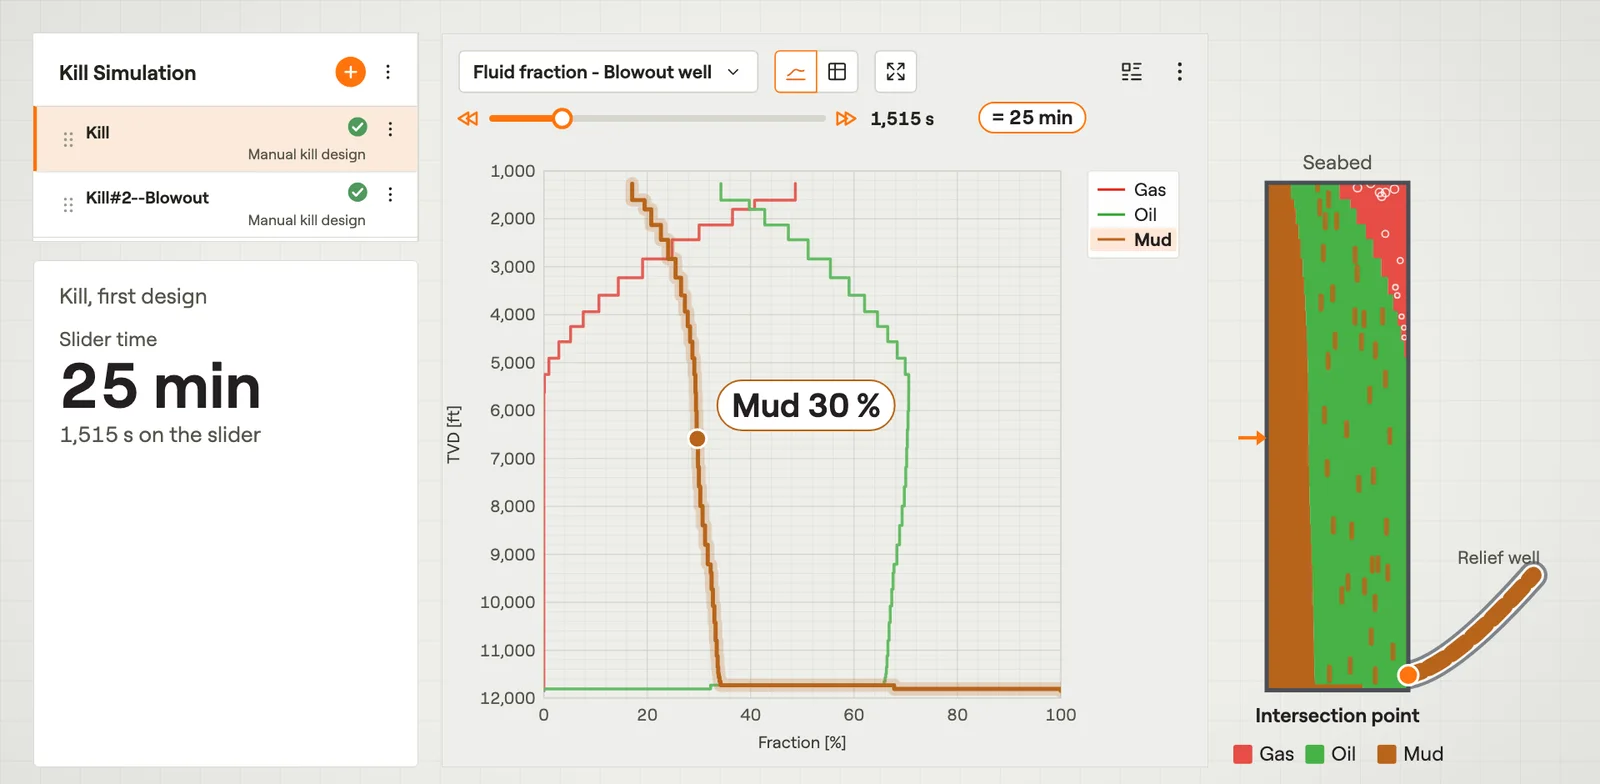 Fluid Fraction & Fluid DensityHow much of the blowout well is filled with gas, oil and mud at each depth.Film · 3:08
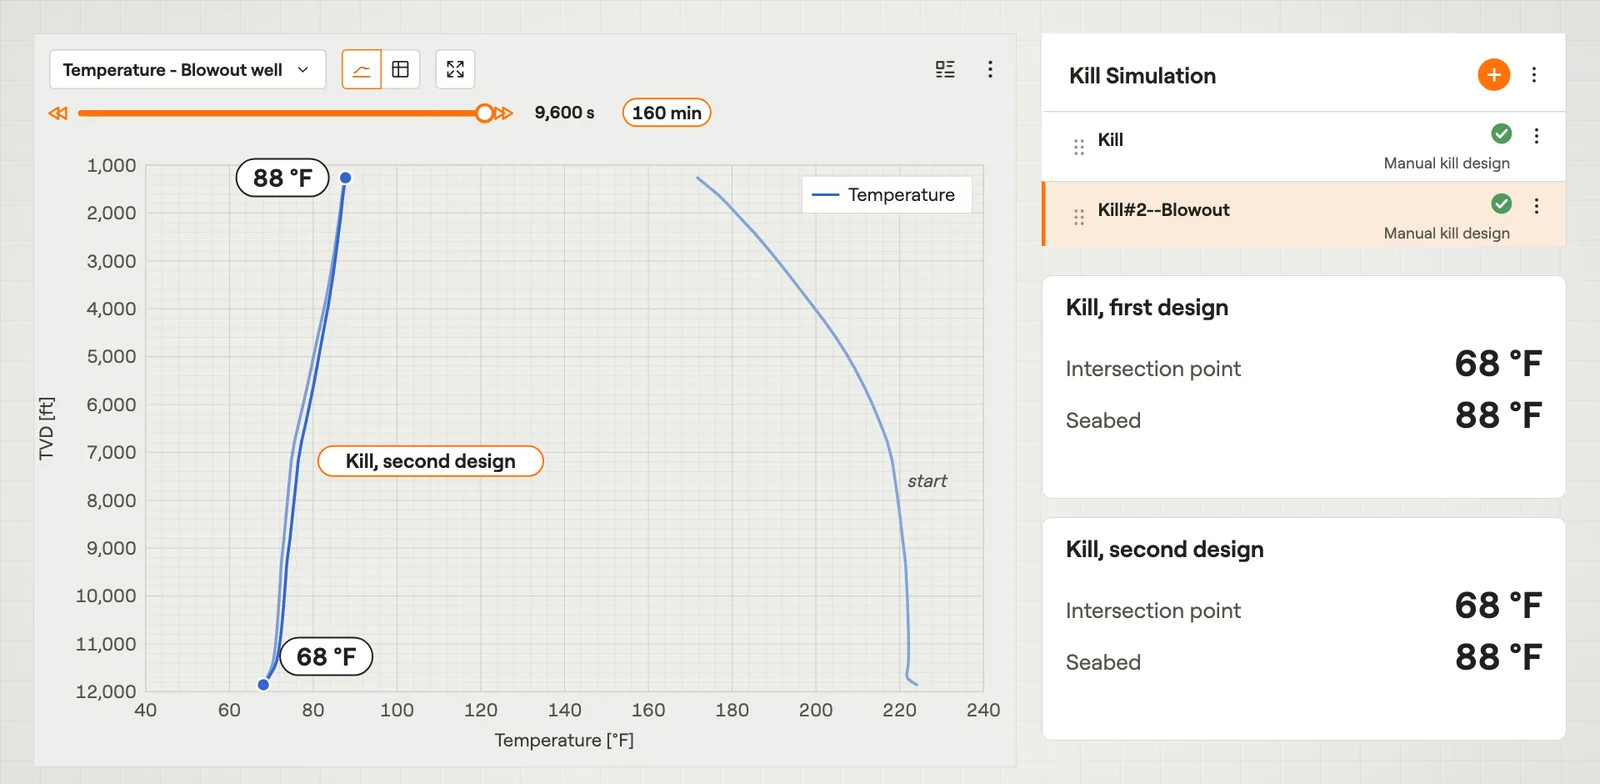 Temperature in the Blowout WellThe temperature of the fluid along the blowout well at one moment of the kill.Film · 2:57